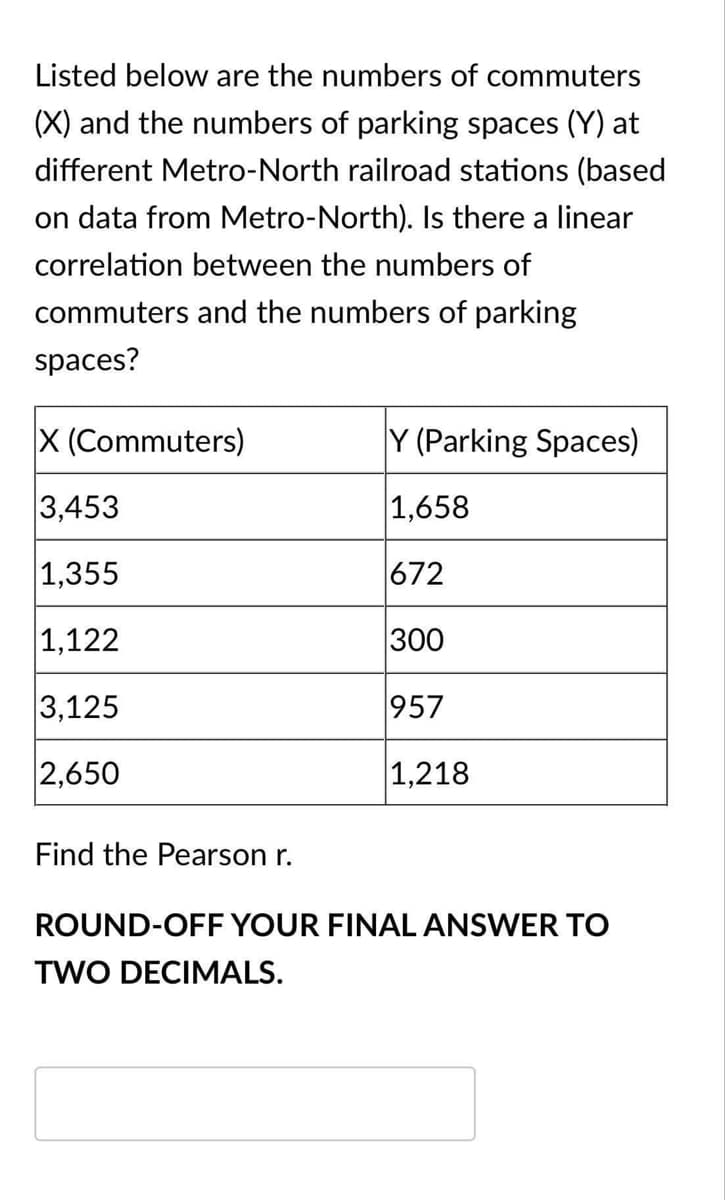
Listed below are the numbers of commuters (X) and the numbers of parking spaces (Y) at different Metro-North railroad stations (based on data from Metro-North). Is there a linear correlation between the numbers of commuters and the numbers of parking spaces? X (Commuters) Y (Parking Spaces) 3,453 1,658 1,355 672 1,122 300 3,125 957 2,650 1,218 Find the Pearson r. ROUND-OFF YOUR FINAL ANSWER TO TWO DECIMALS.


Q: Listed below are numbers of Internet users per 100 people and numbers of scientific award winners…
A: Enter the data in Excel.
Q: The weights (in pounds) of 6 vehicles and the variability of their braking distances (in feet) when…
A: Since we only require to test whether the correlation is significant or not that is if the…
Q: Listed below are numbers of Internet users per 100 people and numbers of scientific award winners…
A: The given data is as follows:
Q: Listed below are numbers of Internet users per 100 people and numbers of scientific award winners…
A: Since you have asked multiple question, we will solve the first question for you. If you want any…
Q: Listed below are numbers of Internet users per 100 people and numbers of scientific award winners…
A: Step-by-step procedure to construct scatterplot using Excel: Select Choose Scatter under Charts.…
Q: Listed below are numbers of Internet users per 100 people and numbers of scientific award winners…
A: Here, we are given a certain data, based on the number of internet user (/100 person) , and the…
Q: D. A group of research students wants to determine whether there is a correlation between the number…
A: Given : Month X (No. of theft cases) Y(No. Vandalism cases) Jun 6 3 Jul 15 6 Aug 30 15…
Q: Listed below are numbers of Internet users per 100 people and numbers of scientific award winners…
A: Correlation coefficient is given by,
Q: The linear correlation coefficient is r=__ (round to three decimal places as needed) =0/=0 The…
A: The scatterplot is obtained by using EXCEL. The software procedure is given below: In first column…
Q: Listed below are numbers of Internet users per 100 people and numbers of scientific award winners…
A: State the hypotheses.
Q: Listed below are numbers of Internet users per 100 people and numbers of scientific award winners…
A:
Q: Given the supply of a commodity, x, and the price of a commodity, y, would you expect a positive…
A: The supply of a commodity is directly related to its price. If a price of a good increase, the…
Q: The weights (in pounds) of 6 vehicles and the variability of their braking distances (in feet)…
A: The correlation coefficient, r, defines the strength and direction of the linear relationship…
Q: Listed below are numbers of Internet users per 100 people and numbers of scientific award winners…
A: Given data : X Y 79.9 5.4 80.4 9.3 57.1 3.3 66.5 1.7 77.5 10.5 37.9 0.1
Q: Which of the following is the most suitable interpretation of the (Pearson) correlation coefficient…
A: The correlation coefficient measures the strength and direction of linear relationship between two…
Q: Listed below are numbers of Internet users per 100 people and numbers of scientific award winners…
A: The following information has been given: Internet Users (x) Award Winners (y) 81 5.5 78.2…
Q: Listed below are numbers of Internet users per 100 people and numbers of scientific award winners…
A: According to the following information, The data is as follows: X Y 79.9 5.3 80.2 8.7…
Q: Listed below are numbers of Internet users per 100 people and numbers of scientific award winners…
A: Steps of create scatter Plot; 1. Enter the data in excel then, go to insert --- scatter plot ----…
Q: Listed below are numbers of Internet users per 100 people and numbers of scientific award winners…
A: Enter the data in Excel.
Q: Listed below are numbers of Internet users per 100 people and numbers of scientific award winners…
A: Given: Internet users Award Winners 79.9 5.4 80.4 9.3 57.1 3.3 66.5 1.7 77.5 10.5…
Q: ted below are numbers of registered pleasure boats in Florida measured in tens of thousands (the…
A:
Q: Listed below are numbers of Internet users per 100 people and numbers of scientific award winners…
A: Scatter plot :
Q: Listed below are numbers of Internet users per 100 people and numbers of scientific award winners…
A: The scatter plot is as follows:
Q: A group of research students wants to determine whether there is a correlation between the number of…
A: Given: X Y 6 3 15 6 30 15 12 5 20 15 9 7 2 0 10 21 11 4 28 12
Q: Listed below are the overhead widths (in cm) of seals measured from photographs and the weights (in…
A: Use the excel tools to draw the scatter plot with the help of following steps: Enter the data…
Q: Listed below are the overhead widths (in cm) of seals measured from photographs and the weights (in…
A: Solution a) construct scatter plot Answer : Option A) shows scatter plot b) Linear correlation…
Q: listed below are numbers of Internet users per 100 people and numbers of scientific award winners…
A: Given data shows numbers of Internet users per 100 people and numbers of scientific award winners…
Q: The following data represents the grades of a sample of 12 students in statistics and economics as…
A:
Q: The weights (in pounds) of 6 vehicles and the variability of their braking distances (in feet)…
A: Given the weights (in pounds) of 6 vehicles and the variability of their braking distances (in…
Q: The following calculator screenshots show the scatterplot and the correlation coefficient between…
A: Correlation: A statistical method that is applied between the pairs of variables to check how the…
Q: The weights (in pounds) of 6 vehicles and the variability of their braking distances (in feet) when…
A: The claim of the test is that there is a significant linear correlation between vehicle weight and…
Q: Listed below are amounts of bills for dinner and the amounts of the tips that were left. Construct a…
A: The correlation coefficient is used to measure the linear relation between two variables. There will…
Q: Listed below are numbers of Internet users per 100 people and numbers of scientific award winners…
A:
Q: Listed below are numbers of Internet users per 100 people and numbers of scientific award winners…
A: The independent variable is Internet Users. The dependent variable is Award Winners. The given data…
Q: Will the following variables have positive correlation, negative correlation, or no correlation?…
A: Positive Correlation - Two variables are said to be positively correlated if one variable is found…
Q: Listed below are numbers of Internet users per 100 people and numbers of scientific award winners…
A: Solution i) The linear correlation coefficient r = 0.773
Q: Suppose a study finds that the correlation coefficient relating job satisfaction to salary is r=1.…
A: Given:
Q: Listed below are numbers of Internet users per 100 people and numbers of scientific award winners…
A: Q1. Scatter Plot. Option B.
Q: A random sample of 8 car drivers insured with a business and having a similar insurance policies…
A: 2.1 By using the MS-Excel, create a scatterplot using the following steps: Enter the driving…
Q: Listed below are numbers of Internet users per 100 people and numbers of scientific award winners…
A: Use EXCEL to construct the scatter plot. EXCEL procedure: Go to EXCEL Go to Insert menu…
Q: Listed below are numbers of Internet users per 100 people and numbers of scientific award winners…
A: Calculate Correlation Coefficient r without cov(x,y) from the following data X Y 77.9 5.5…
Q: Listed below are numbers of Internet users per 100 people and numbers of scientific award winners…
A: Enter the data in Excel.
Q: A 1982 paper by Hans Rosendal and Samuel Shaw established a correlation between the maximum…
A: Given that, a 1982 paper by Hans & Samuel established correlation between the maximum sustained…
Q: Listed below are numbers of Internet users per 100 people and numbers of scientific award winners…
A: Solution a) Option c) shows correct scatter plot c) linear correlation coefficient r= 0.783…
Q: Listed below are the overhead widths (in cm) of seals measured from photographs and the weights (in…
A: Scatter plot: Steps to construct scatter plot in Excel: Enter the data for Overhead width and…
Q: The following calculator screenshots show the scatterplot and the correlation coefficient between…
A: From the diagram, we can see that as the number of days absent increases, their grades are…
Q: Listed below are numbers of Internet users per 100 people and numbers of scientific award winners…
A: Solution-: (a) We draw the scatter plot of Internet Users and Award Winners. Also calculate…
Q: Listed below are numbers of Internet users per 100 people and numbers of scientific award winners…
A:
Q: Listed below are the amounts of bills for dinner and the amounts of the tips that were left.…
A: The linear correlation coefficient is r= 0.688 Solution
Q: Listed below are numbers of Internet users per 100 people and numbers of scientific award winners…
A: Given data


Trending now
This is a popular solution!

Step by step
Solved in 3 steps with 2 images

- For a symmetric bell shaped data, of the five number summary are: 6,10, Y, 16 ,x thenAn automobile dealer conducted a test to determine if the time in minutes needed to complete a minor engine tune-up depends on whether a computerized engine analyzer or an electronic analyzer is used. Because tune-up time varies among compact, intermediate, and full-sized cars, the three types of cars were used as blocks in the experiment. The data obtained follow. Analyzer Computerized Electronic Car Compact 52 43 Intermediate 55 44 Full sized 61 45 Use ? = 0.05 to test for any significant differences. State the null and alternative hypotheses. H0: ?Compact ≠ ?Intermediate ≠ ?Full-sizedHa: ?Compact = ?Intermediate = ?Full-sized H0: ?Compact = ?Intermediate = ?Full-sizedHa: ?Compact ≠ ?Intermediate ≠ ?Full-sized H0: ?Computerized = ?Electronic = ?Compact = ?Intermediate = ?Full-sizedHa: Not all the population means are equal. H0: ?Computerized ≠ ?ElectronicHa: ?Computerized = ?Electronic H0: ?Computerized = ?ElectronicHa: ?Computerized ≠ ?Electronic Find the…An automobile dealer conducted a test to determine if the time in minutes needed to complete a minor engine tune-up depends on whether a computerized engine analyzer or an electronic analyzer is used. Because tune-up time varies among compact, intermediate, and full-sized cars, the three types of cars were used as blocks in the experiment. The data obtained follow. Analyzer Computerized Electronic Car Compact 49 41 Intermediate 55 44 Full-sized 64 47 Use ? = 0.05 to test for any significant differences. Find the value of the test statistic. (Round your answer to two decimal places.) Find the p-value. (Round your answer to three decimal places.) p-value =
- For unemployed persons in the United States, the average number of months ofunemployment at the end of December 2009 was approximately seven months(Bureau of Labor Statistics, January 2010). Suppose the following data are for aparticular region in upstate New York. The values in the first column show thenumber of months unemployed and the values in the second column show thecorresponding number of unemployed persons.MonthsUnemployedNumberUnemployed1 10292 16863 22694 26755 34876 46527 41458 35879 2325 10 1120Let x be a random variable indicating the number of months a person is unemployed.a. Use the data to develop an empirical discrete probability distribution for x.b. Show that your probability distribution satisfies the conditions for a validdiscrete probability distribution.c. What is the probability that a person is unemployed for two months or less?Unemployed for more than two months?d. What is the probability that a person is unemployed for more than sixmonths?Draw a scatter diagram for a set of data that has an r= -1here is the full data set Carpeted Uncarpeted 10.5 2.6 13 11.3 14.7 6 6.4 3.6 14 7.9 14.5 7.7 15.8 4.9 6.6 9.5
- The higher education department of Institute recorded data on the number of studentsenrolled in the different study majors for the years 2018 and 2019. Study Major 2018 2019 Statistics 1700 2250 Business Law 700 900 Accounting 1300 1450 Economics 750 1000 Finance 1450 1758 Marketing Management 1069 1189 Auditing 360 351 a) Use an appropriate graphical technique or chart to compare the number of enrolment in 2018and 2019 of the different study major. Display the chart. b) Use an appropriate graphical technique or chart to display the percentage value of the numberof enrolment of the different study major in 2018 and 2019. Display the chart.An automobile dealer conducted a test to determine if the time in minutes needed to complete a minor engine tune-up depends on whether a computerized engine analyzer or an electronic analyzer is used. Because tune-up time varies among compact, intermediate, and full-sized cars, the three types of cars were used as blocks in the experiment. The data obtained follow. Analyzer Computerized Electronic Car Compact 51 42 Intermediate 55 43 Full-sized 62 47 Use ? = 0.05 to test for any significant differences. State the null and alternative hypotheses. H0: ?Computerized ≠ ?ElectronicHa: ?Computerized = ?ElectronicH0: ?Computerized = ?Electronic = ?Compact = ?Intermediate = ?Full-sizedHa: Not all the population means are equal. H0: ?Computerized = ?ElectronicHa: ?Computerized ≠ ?ElectronicH0: ?Compact ≠ ?Intermediate ≠ ?Full-sizedHa: ?Compact = ?Intermediate = ?Full-sizedH0: ?Compact = ?Intermediate = ?Full-sizedHa: ?Compact ≠ ?Intermediate ≠ ?Full-sized Find the value of…You work for an insurance company and are studying the relationship between types of crashes and the vehicles involved. As part of your study, you randomly select 3589 vehicle crashes and organize the resulting data as shown in the contigency table. At α=0.10, can you conclude that the type of crash depends on the type of vehicle? Complete parts (a) through (d). Vehicle Type of crash Car Pickup Sport utility Single-vehicle 866 323 340 Multiple-vehicle 1145 487 428 Question content area bottom Part 1 (a) Identify the claim and state the null and alternative hypotheses. H0: The type of crash and the type of vehicle are ▼ independent dependent Ha: The type of crash and the type of vehicle are ▼ dependent independent The ▼ alternative hypothesis null hypothesis is the claim. H0: The type of crash and the type of vehicle are Ha: The type of crash and the type of vehicle are Determine…
- You work for an insurance company and are studying the relationship between types of crashes and the vehicles involved. As part of your study, you randomly select 3589 vehicle crashes and organize the resulting data as shown in the contigency table. At α=0.10, can you conclude that the type of crash depends on the type of vehicle? Complete parts (a) through (d). Vehicle Type of crash Car Pickup Sport utility Single-vehicle 866 323 340 Multiple-vehicle 1145 487 428 Question content area bottom Part 1 (a) Identify the claim and state the null and alternative hypotheses. H0: The type of crash and the type of vehicle are ▼ independent dependent . Ha: The type of crash and the type of vehicle are ▼ dependent independent . The ▼ alternative hypothesis null hypothesis is the claim.Lin Chi-Ling works for an insurance company and is studying the relationship between types of crashes and the vehicles involved in passenger vehicle occupant deaths. As part of your study, you randomly select 4270 vehicle crashes and organize the resulting data as shown in the contingency table. At α = 0.05 can you conclude that the type of crash depends on the type of vehicle? Vehicle Type of crash Car Pickup Sport utility Single-vehicle 1237 547 479 Multiple-vehicle 1453 307 247 What is the Chi-square test statistics and the decision for this question. The Test statistics is . Leave answers in 3 decimal places. DECISION: We the null hypothesis.Brand Apple Samsung LG Basicmobilephone Othersmartphone Do notuse mobilephone Total Gender Male 108 30 5 2 23 0 168 Female 161 32 0 0 9 0 202 Total 269 62 5 2 32 0 370 b. Derive a relative frequency cross classification table based on row totals (i.e., gender) using the table in above. Brand Apple Samsung LG Basicmobilephone Othersmartphone Do notuse mobilephone Total Gender Male Female - Total

