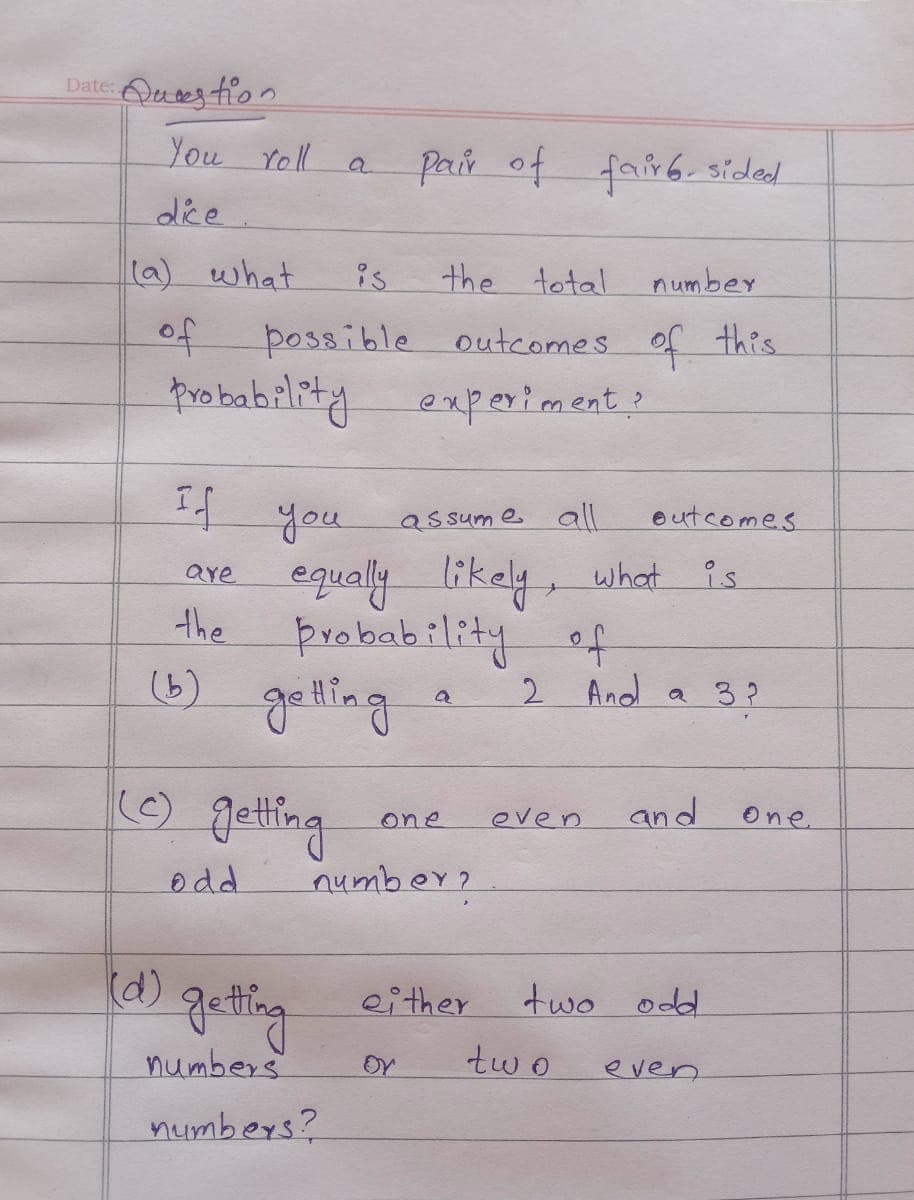
dice (a) what of is possible pair of the tota outcomes


Q: E[Y|X] = XB Similarly, we will assume linearity of the conditional quantile functio Q(T|X) = XB₂ The…
A: The quantile regression Process: Consider Qyτ|x be the τ-conditional quantile of Y given X=x…
Q: The Great Britain Office of Population Census and Surveys once collected data on a random sample of…
A: Correlation means the change in one variable affects the change in the values of another variable.…
Q: Professor Brown and Professor Sides both teach Statistics at the same college. They each have two…
A:
Q: A normally distributed random variable has a mean of 449. If a score of 433 lies two standard…
A: Given: μ=449 A score of 433 lies two standard deviations below the mean, it means that, μ-2σ=433
Q: Given the following values of correlation coefficients: A) +.02 B) -.45 C) -.35 D) +1.10…
A: Given information: The correlation coefficient is denoted by r. So the given r values are A) +0.02…
Q: A payoff table is given below with the probabilities of s2 = 0.17 and s3 = 0.34. What is the…
A: For the given data What is the expected value of the best decision ?
Q: O Suppose that a random variable X has a continuous distribution for which the probability density…
A:
Q: A random sample of 876 births included 430 boys. Use a 0.05 significance level to test the claim…
A: Given that p = 50.7% , n = 876
Q: The accompanying table describes results from groups of 8 births from 8 different sets of parents.…
A: a. The probability distribution table of 6 girls in 8 births is given.
Q: The results of a two-factor analysis of variance produce df = 2, 36 for the F-ratio for factor A and…
A: We have given that Degree of freedom of F-ratio for factor A is 2,36 And, Degree of freedom of…
Q: Suppose that a random sample X is given by a probability density function - {/²0 (B-2), 0<x<B 0,…
A:
Q: This is very helpful, thank you! Could you please share the excel fomulas used to acheve this?
A: The given data is entered in excel as shown below
Q: Find the area under the normal curve to the left of z=−1.54 plus the area under the normal curve to…
A: The given z scores are z=-1.54 and z=2.54.
Q: LE+ T₁, T2, T3, T4, Is and X₁, X₂, Xq be Independent and normally distributed random Sampits From…
A: It is given that Yi~N2, 5∀ i=1,2,…,5 and Xi~N8, k∀ i=1,2,…,9. According to the property of normal…
Q: 1 For each series below, decide whether it is arithmetic or geometric, then find the sum. a 5 15 15…
A: We have given that 1/5 + 8/15 +13/15 + ... S7 Let here a1 = 1/5, a2 = 8/15, a3 = 13/15
Q: In a certain hospital, there is a mortality rate of 15% for patients with benign brain tumor. In a…
A: The question is about confidence interval Given : Mortality rate of patients with benign brain tumor…
Q: Use sensitivity analysis. List the decision alternatives from lowest expected value to highest when…
A:
Q: ata by the rest of the brain, particu scale up with the size of animals' sented differentially…
A: You can use a statistical technique called simple linear regression to comprehend the relationship…
Q: 1)In your own words, discuss what a p-value is and why we prefer to use them when undertaking…
A: Since you have asked multiple questions, we will solve the first question for you. If you want any…
Q: Consider the following regression model: Dependent Variable: MU Sample: 134
A: Solution The given analysis is the regression analysis.
Q: Assuming all conditions for conducting a hypothesis test are met, what are the null and alternative…
A: Given The mean tomato length is greater than 2.6 miles
Q: Problem 4. A large company is conducting a study on commuting distance among its employees. A sample…
A: Solution: Given information: n1=35 Sample size of NewYork employeesn2=40 Sample size of Chicago…
Q: thats what i got aswell when i worked it but its saying that the answer is incorrect
A: Solution To fund the probability we will use Bayes theorem.
Q: A random sample of 37 adults had a sample mean height of 168 cms with a sample standard deviation of…
A: Here, x¯=168, s=10, and n=37.
Q: A fair coin is flipped 4 times. a) What is the probability that the number of tails flipped is even?…
A: GivenA fair coin is flipped 4 times
Q: Determine the area under the standard normal curve that lies to the left of (a) Z=0.59, (b)…
A: Dear students as per guidelines we solve only first three subparts of the given questions. Solution
Q: Data was collected for a sample of organic snacks. The amount of sugar (in mg) in each snack is…
A: The amount of sugar(in mg) in each snack is summarized in the histogram below.Given histogram data:
Q: Risky drivers: An automobile insurance company divides customers into three categories: good risks,…
A: The total number of customers is n = 11074.
Q: You are given the following double-decrement table:
A: Given information: x dx1 dx2 50 10 5 51 9 7 52 8 10 53 7 15 Formula: qnxj=dnxjlx(τ)…
Q: 147 153 166 173 186 182 183 186 182 166 182 163 153 145 1.…
A: Data given 147,153,166,173,186,182,183,186,182,166,182,163,153,145
Q: Suppose the probability of an IRS audit is 2.9 percent for U.S. taxpayers who file form 1040 and who…
A: Given that p = 2.9% = 0.029 , q = 1 - p = 1 - 0.029 = 0.971 p = The probability of an IRS audit
Q: Find the proportion of a standard Normal model found in the given region. Round to three decimal…
A: Find P(0<Z<3.01)=?
Q: Let Y₁, Y₂, Y3, Y₁, Ys and X₁, X₂, X, be independent and normally distributed random samples from…
A: Given that If P(X--Y->10)=0.02275 We have to find the value of k:
Q: In a study of the accuracy of fast food drive-through orders, one restaurant had 36 orders that were…
A: From the provided information, Sample size (n) = 346 From which 36 orders were not accurate. Sample…
Q: 17 and 18: Suppose that the systolic blood pressures of men age 18 to 29 years vi Tuva normal…
A: Please note that as per our guidelines if multiple questions are posted we can answer the first…
Q: See the Regression model below. How much in Advertising do you predict is need to sell 350 tickets?…
A: The intercept value (a) is 110.23.
Q: Exe Algo of Distribution Shape, Relative Location, and Detecting Outliers) Suppose the data have a…
A:
Q: The following are goals scored by a soccer team at each game in their recent season. 0 1 1 2 3 OO 4…
A: here frequency of goals are given in the data,here wehave to find out the relative frequency for…
Q: The Chamber of Commerce in a Canadian city has conducted an evaluation of 300 restaurants in its…
A: For the given data Find all the required blanks E(X) =? Var(x) =? E(y) =? Var(y ) =? Co(x,y) =?
Q: Question: Is it possible that 70% of all students are below average?
A: From given data we have Prof. Brown Weighted Average: 76 Prof. Sides Weighted Average: 79
Q: Months 1 2 3 14 885 Using exponential smoothing, with a smoothing constant of 0.14, forecast the…
A: The number of customers in a month is given.
Q: Quality control: A population of 610 semiconductor wafers contains wafers from three lots. The…
A: Note: If the post contains multiple subparts only allow to do first 3 subparts as per guidelines of…
Q: Use z scores to compare the given values
A:
Q: The number of chocolate chips in an 18-ounce bag of chocolate chip cookies is approximately…
A:
Q: Determine the total area under the standard normal curve (a) Find the area under the normal…
A: z be a standard normal distribution with mean=0 and standard deviation=1 i. e. z~N0,1
Q: (b) Construct a relative frequency distribution of the data. Potholes Relative Frequency 1 2 3 4 5 6…
A:
Q: s included as an additional data value in Set A. Compute x for the new data set. To compu
A: In above example we have given mean and its sample size and by adding new observation we have to…
Q: Using the 4 weeks of data below, forecast sales for the fifth week using a 3-week weighted moving…
A: From the given data Forecast sales for the fifth week = ?
Q: Consider the table below. Classes Frequency, Cumulative Midpoint, fm (Mass) Frequency (kg) f 30.00 <…
A: Determine the missing value of A. The missing value of A is obtained below as follows: From the…
Q: Suppose the monthly charges for cell phone plans are normally distributed with mean μ=$69 and…
A: (a) Plot the normal curve with the labels.

Step by step
Solved in 2 steps

- In a two-tailed test of hypothesis, the sign in the alternative hypothesis is: not equal to b. greater than c. less than d. equal toIdentify the null and alternative hypotheses: H0: σ, p, or μ | >, =, ≠, or < ___________ H1: σ, p, or μ | >, =, ≠, or < ____________A statistician has to decide on the basis of two obser-vations whether the parameter θ of a binomial distribu-tion is 1 4 or 12 ; his loss (a penalty that is deducted from hisfee) is $160 if he is wrong.(a) Construct a table showing the four possible values ofthe loss function. (b) List the eight possible decision functions and con-struct a table showing all the values of the corresponding risk function.(c) Show that three of the decision functions are notadmissible.(d) Find the decision function that is best according to theminimax criterion.(e) Find the decision function that is best according to theBayes criterion if the probabilities assigned to θ = 14 and θ = 12 are, respectively, 23 and 13 .
- It has been found that 2 out of every 10 people who visit a local store purchasemilk. If we randomly select a sample of 13 visitors to the store, what is theprobability that:Q.2.2.2 More than three of the visitors will purchase milk? Interpret youranswer.A teacher is comparing the mena study time of his freshmen and senior students. He believes that his senior students spend more time studyin per week than his freshmen studnet and decides to perform a hypothesis test on his belief. a. Suppose the decision of the hypothesis test is to reject the null hypothesis. If, in realiry, treshmen study for a mean of 10 hours per week and seniors study for a mena of 15 hours per week, was an error made? if so, what type? b. Suppose the decision of the hypothesis test is to fail to reject the null hypothesis. if, in realiry, freshmen study for a mena of 15 hours per seek and seniors study for a mean of 15 hours per week, was an error made? is so, what type?If the null and alternative hypotheses areH0:μ=23H1:μ>23Then the test is left-tailed right-tailed two-tailed
- A television executive believes that at least 99% of households in the US have at least one television. An intern at the executive's company is given the task of using a hypothesis test to determine whether the percentage is actually less than 99%. The intern decides to fail to reject the null hypothesis. If, in realiry, 96.7% of house holds own a television set, was an error made? if so, what type.It has been found that 2 out of every 10 people who visit a local store purchasejuice. If we randomly select a sample of 13 visitors to the store, what is theprobability that: No more than two of the visitors will purchase juice? Interpret youranswer.In a specific population of adult migraine sufferers in the US, the average number of migraines per month is 9. An acupuncturist claims that her treatment can reduce this figure significantly. On your own scrap paper, explore the possible errors with a Type 1/2 error chart, making note of the meaning of each possibility. Decision H0H0 is Actually True False Reject H0H0 and Accept HaHa Fail to Reject H0H0 Select the Null and Alternative Hypotheses to the scenario using the correct symbols. H0H0: μ<9μ<9HaHa: μ=9μ=9 H0H0: μ>9μ>9HaHa: μ=9μ=9 H0H0: μ=9μ=9HaHa: μ>9μ>9 H0H0: μ=9μ=9HaHa: μ<9μ<9 Explain what a type 1 error is in this scenario. A type 1 error would be concluding that the migraine treatment can reduce occurence of frequent migraines when in fact, it can. A type 1 error would be concluding that the migraine treatment can reduce occurence of frequent migraines when in fact, it cannot. A type 1 error would be concluding…
- A research center claims that 29% of adults in a certain country would travel into space on a commercial flight if they could afford it. In a random sample of 1000 adults in that country, 33% say that they would travel into space on a commercial flight if they could afford it. At α=0.10, is there enough evidence to reject the research center's claim? (a) Identify the claim and state H0 and Ha. Identify the claim in this scenario. Select the correct choice below and fill in the answer box to complete your choice. (Type an integer or a decimal. Do not round.) A. No more than nothing% of adults in the country would travel into space on a commercial flight if they could afford it. B. nothing% of adults in the country would travel into space on a commercial flight if they could afford it. C. The percentage adults in the country who would travel into space on a commercial flight if they could afford it is not nothing%. D. At least nothing% of…It has been found that 2 out of every 10 people who visit a local store purchasemilk. If we randomly select a sample of 13 visitors to the store, what is theprobability that:Q.2.2.1 No more than two of the visitors will purchase milk? Interpret youranswer.It is known that about 20% of all undergraduate students have experienced math anxiety. Arandom sample of 8 undergraduate students is selected from a big university. Find theprobability that:a) exactly 3 of those 8 students have experienced math anxiety. b) at least 2 students have experienced math anxiety.


