difference between two population means - Independent

Glencoe Algebra 1, Student Edition, 9780079039897, 0079039898, 2018
18th Edition
ISBN:9780079039897
Author:Carter
Publisher:Carter
Chapter10: Statistics
Section10.3: Measures Of Spread
Problem 1GP

Related questions
Question
2. Inferences about the difference between two population means - Independent samples, population standard deviations known
Consider a pool of home mortgages. Prepayments of mortgages in the pool affect the mortgages’ cash flow, so mortgage lenders, servicers, and investors all have an interest in predicting mortgage prepayments. Mortgages may be prepaid for a variety of purposes, including selling the home, taking cash out of the property to fund home improvements or other consumer expenditures, or refinancing the mortgage to change the monthly payment schedule.
Narrow your focus to mortgage prepayments that are made for the purpose of refinancing. If there were no costs to refinancing, you would refinance to reduce your monthly payments every time the current mortgage rate dropped below the rate on your mortgage. In actuality, however, there are costs to refinancing, such as points and closing fees. Therefore, the spread between the current mortgage rate and your own rate must be big enough to more than make up for the costs, or you wouldn’t be interested in refinancing.
The economics of refinancing suggest that there should be no difference between the number of points on refinanced mortgages and mortgages that are not refinanced. Unlike the points paid on the new mortgage, points paid on the original mortgage are a sunk cost that should not be considered in the refinancing decision.
Define population 1 as mortgages that are refinanced, and define population 2 as mortgages that are not refinanced. Let µ₁ equal the mean points paid on refinanced mortgages, and let µ₂ equal the mean points paid on mortgages that are not refinanced. Similarly, let σ₁ and σ₂ equal the standard deviations of points paid for populations 1 and 2. Assume that σ₁ = 0.94 and σ₂ = 1.09.
In a study, professor Michael LaCour-Little selected independent random samples of mortgages that were refinanced and mortgages that were not refinanced, and he collected data on points paid. (Source: Michael LaCour-Little, “Another Look at the Role of Borrower Characteristics in Predicting Mortgage Prepayments,” Journal of Housing Research, Volume 10, Issue 1.)
For the sample drawn from refinanced mortgages, the sample size n₁ = 356, and the sample mean x̄ x̄₁ = 0.69. For the sample drawn from mortgages that were not refinanced, the sample size n₂ = 350, and the sample mean x̄ x̄₂ = 0.89. (Note: The sample means match those from the study, but the sample sizes have been reduced.)
The point estimate of µ₁ – µ₂ is .
In this study, the sampling distribution of x̄ x̄₁ – x̄ x̄₂ is approximated by a ____(ans options = t, standard normal, normal, uniform) distribution with ___ (ans options = a mean equal to the unknown value of h1-h2, a mean of 0.2, a mean of -0.2 ,a mean of 0) and a standard deviation ___ (ans options = of 1.09, 0.0767, that is unkown, of 0.94) .
Use the Distributions tool to help you answer the questions that follow.
The 95% confidence interval estimate of the difference between µ₁ and µ₂ is ____ to ___ .
You want to verify that there is no difference between the mean points paid on refinanced mortgages and mortgages that are not refinanced, as the economics of refinancing suggests. You test the hypothesis that there is no difference between the mean points paid.
The null and alternative hypotheses are formulated as:
a. H₀: µ₁ – µ₂ ≠ 0, Haa: µ₁ – µ₂ = 0
b. H₀: µ₁ – µ₂ = 0, Haa: µ₁ – µ₂ ≠ 0
c. H₀: x̄ x̄₁ – x̄ x̄₂ = 0, Haa: x̄ x̄₁ – x̄ x̄₂ ≠ 0
d. H₀: µ₁ – µ₂ ≤ 0, Haa: µ₁ – µ₂ > 0
The test statistic for the hypothesis test is____ .
The p-value is ____ .
A level of significance of α = 0.05 is specified for the study. The null hypothesis is ____ . Therefore, you ____ conclude that there is a difference between the mean points on refinanced mortgages and mortgages that are not refinanced.
Transcribed Image Text:5
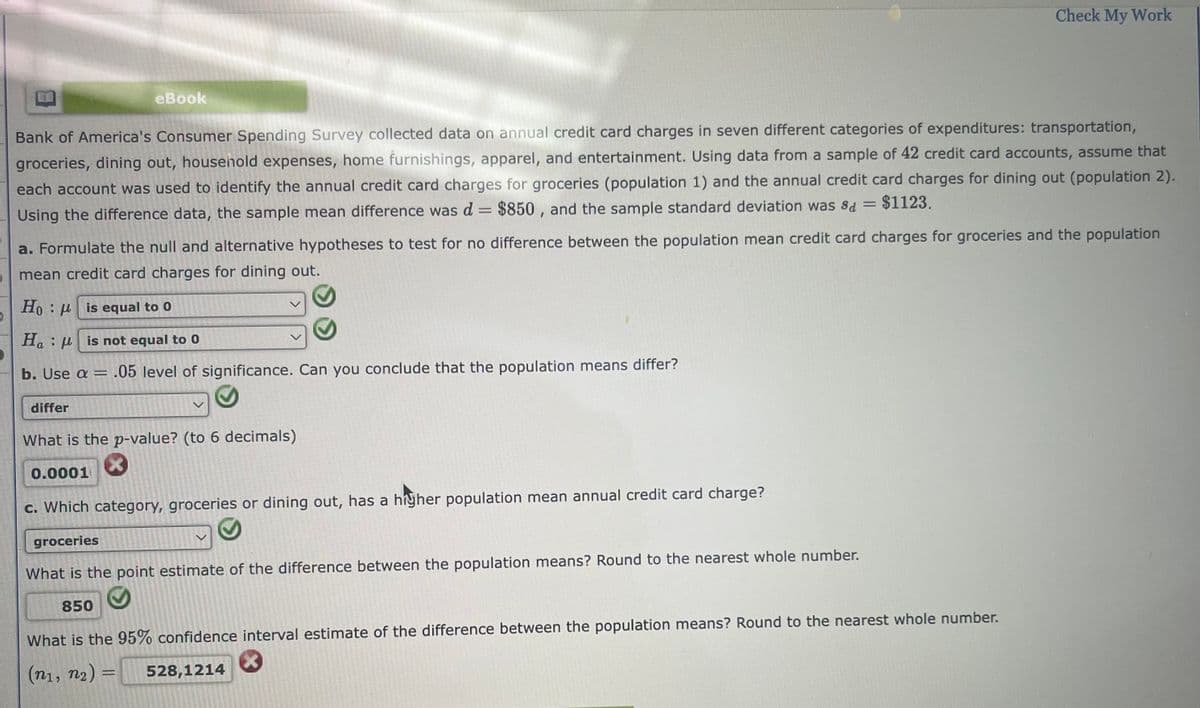
eBook
Bank of America's Consumer Spending Survey collected data on annual credit card charges in seven different categories of expenditures: transportation,
groceries, dining out, household expenses, home furnishings, apparel, and entertainment. Using data from a sample of 42 credit card accounts, assume that
each account was used to identify the annual credit card charges for groceries (population 1) and the annual credit card charges for dining out (population 2).
Using the difference data, the sample mean difference was d = $850, and the sample standard deviation was sd = $1123.
differ
a. Formulate the null and alternative hypotheses to test for no difference between the population mean credit card charges for groceries and the population
mean credit card charges for dining out.
Ho
is equal to 0
Ha
is not equal to 0
b. Use a = .05 level of significance. Can you conclude that the population means differ?
What is the p-value? (to 6 decimals)
X
0.0001
Check My Work
c. Which category, groceries or dining out, has a higher population mean annual credit card charge?
groceries
What is the point estimate of the difference between the population means? Round to the nearest whole number.
850
What is the 95% confidence interval estimate of the difference between the population means? Round to the nearest whole number.
(n₁, n₂) =
528,1214
Expert Solution
This question has been solved!
Explore an expertly crafted, step-by-step solution for a thorough understanding of key concepts.

This is a popular solution!

Trending now
This is a popular solution!

Step by step
Solved in 4 steps with 2 images

Recommended textbooks for you
Glencoe Algebra 1, Student Edition, 9780079039897…
Algebra
ISBN:
9780079039897
Author:
Carter
Publisher:
McGraw Hill

College Algebra (MindTap Course List)
Algebra
ISBN:
9781305652231
Author:
R. David Gustafson, Jeff Hughes
Publisher:
Cengage Learning
Glencoe Algebra 1, Student Edition, 9780079039897…
Algebra
ISBN:
9780079039897
Author:
Carter
Publisher:
McGraw Hill
College Algebra (MindTap Course List)
Algebra
ISBN:
9781305652231
Author:
R. David Gustafson, Jeff Hughes
Publisher:
Cengage Learning