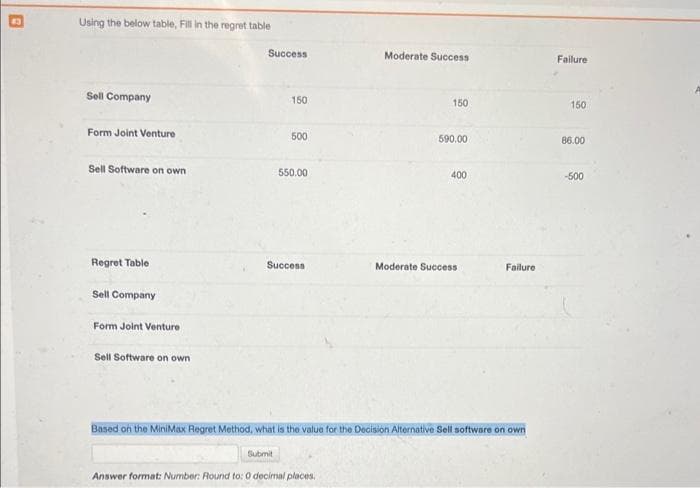
Based on the MiniMax Regret Method, what is the value for the Decision Alternative Sell software on own Submit Answer format: Number: Round to: 0 decimal places.


Q: 1. Given the following empirical distribution of variable x, CONT(0.25, 1, 0.7, 2, 1, 3), Generate a…
A: The distribution function is: F(x)=0; x<10.25; 1≤x<20.7; 2≤x<31; 3≤x
Q: Just need part 2 Please do it neat and clean correctly and provide only typed answer solution no…
A: part 2given data 90% ci for pE = 0.07n = ?no prior estimate for p
Q: The Survey of Study Habits and Attitudes (SSHA) is a psychological test with scores that range from…
A: For the SSHA psychological test, the hypothesized mean score for the population (i.e., for the US…
Q: These are data of patients' age at hospital XYZ. Interval of Age (in Frequency years) 60-68 51-59…
A: Answer:- Given frequency distribution table is, Interval of age (in years) Frequency (f) Specific…
Q: llege, 42% of students belong to a campus club, 38% of students participate in team sports, and 5%…
A: Given The events A = the student belongs to at least one club on campus B= Student participates in…
Q: A public opinion organization wants to know if opinions on gun control laws have changed over time.…
A: Given that, a poll conducted in 2006 found that 55% of people favored stricter gun laws.
Q: A university is applying classification methods in order to identify alumni who may be interested in…
A: Given information:The data for the donation and no donation are given.
Q: Consider a random variable X that takes on the following values with the following probabilities:…
A: Answer:- Given, A random variable X that takes on the following values with the following…
Q: Biologists are observing grunion run on a 4- mile long stretch of beach (the starting point is…
A:
Q: Read the scenario and decide which (if any) of the assumptions or conditions for using the Central…
A: The Central Limit Theorem (i.e., CLT) assumed that for a sufficiently large sample size (i.e.,…
Q: Find some examples for each type of probability sampling? Find some examples for each type of…
A: Probability sampling involves random selection, allowing you to make strong statistical inferences…
Q: Storage of Soil Samples. The concentration of benzene (ug/g) in soil was measured after being stored…
A: Given data is: Day Sample size (ni) Sample mean (xi¯) Sample standard deviation (si) 0 3 6.1…
Q: 1. A garlic press factory has four machines turning out garlic presses. Machine 1 makes 35% of the…
A: Given that, The event M1 is the press came from machine 1 The event M2 is the press came from…
Q: In the digital age of marketing, special care must be taken to ensure that programmatic ads appear…
A: Given data: Marketing Managers Marketing Research Advertising 4 7 5 3 7 6 2 6 5 3 6 4…
Q: 10 balls are numbered 1-10 find the probability: a. odd # b. greater than 6 c. ball number 2 d. not…
A: a. It is given that, 10 balls are numbered from 1 to 10.
Q: You may need to use the appropriate appendix table or technology to answer this question. Samples of…
A: The null and alternative hypotheses are: Null hypothesis: The median starting annual salary for…
Q: Determine the population and sample in the situation below. A survey is being taken to determine…
A: Given Information: The situation is, "A survey is being taken to determine what percent of people in…
Q: The graph represents a continuous probability distribution. Use the graph to answer the questions.…
A: Given information: A graph of the continuous probability distribution is given.
Q: Let (8)zo be a Brownian motion. For > B, compute the probability (Bx > 0,8xx 20).
A: Let us define the events A = {BT ≥ 0} and B = {B2t ≤ 0}. Then we want to compute the probability…
Q: 1. Suppose the weight of an adult male German Shepherd is normally distributed with a mean of 36.4…
A: Given that. 1) X~N( μ , ?) μ=36.4 , ?=4.2 Z-score =( x - μ )/? NOTE:- According to bartleby…
Q: The standard deviation of the sampling distribution of difference scores is called the standard: A.…
A: Given information: The standard deviation.
Q: The following sample data are from a normal population: 10, 8, 12, 15, 13, 11, 6, 5. What is the…
A:
Q: to have a be life, or a life about the as yours? question was, "do you expect your chil you ve had,…
A:
Q: 2. The number of hours that employees work per week in Anteater company is known to follow a normal…
A: 2)GivenMean(μ)=40standard deviation(σ)=5
Q: Last August there were 702,924 scheduled passenger flights in a certain country, and in August of…
A: Given: In a certain country, Scheduled passengers flights in August 1998 = 722,811 Scheduled…
Q: it didnt say round though. So is it 62 or 62.4?
A: Since we can't have a fraction of a person, we need to round this value to the nearest whole number.
Q: QUESTION 13 An elementary school is assessing how many activities in which a parent is involved.…
A: Given that: Number of Activities Probability 0 0.035 1 0.074 2 0.197 3…
Q: Problem 7. Let X₁,..., Xn be independent N(0,0²) random variables for some unknown real 0. Find a…
A: ANSWER: Since we have a normal prior distribution with known mean and variance, we can use the…
Q: We wish to estimate what percent of adult residents in a certain county are parents. Out of 400…
A: The question is about confidence interval Given : Randomly selected no. of adults ( n ) = 400 No. of…
Q: Find the area of the shaded region. The graph depicts the standard normal distribution of bone…
A: Answer:- Given, The standard normal distribution of bone density scores with mean 0 and standard…
Q: Consider the hypotheses below. Ho: μ ≥75 H₁: μ< 75 Given that x = 66.8, s = 12.1, n = 20, and a =…
A: Given H0:μ≥75H1:μ<75x =66.8s=12.1n=20α=0.05 a) what conclusion should be drawn ? determine the…
Q: Assume that the readings at freezing on a batch of thermometers are normally distributed with a mean…
A: Answer:- Given, The readings at freezing on a batch of thermometers are normally distributed with a…
Q: Find the 5 number summary for the data shown below. 62 27 33 89 50 32 55 45 22 59 5 number summary:
A: data in accending order are : 22,27,32,33,45,50,55,59,62,89n= 10
Q: Assume that all grade-point averages are to be standardized on a scale between 0 and 4. How many…
A: given data range of data = 0 to 4 σ = range4 = 44 = 1E = 0.008n =…
Q: The A&T pension fund has $13 billion, invested in equities. Assume a normal distribution and…
A:
Q: VUR 1. Suppose the lifetime of a particular brand of light bulbs is exponentially distributed with a…
A:
Q: Assume that adults have IQ scores that are normally distributed with a mean of μ= 105 and a standard…
A: The given values are: μ=105 and σ=15.
Q: You wish to test the following claim (Ha) at a significance level of α=0.10. Ho:μ=73.2…
A: Given The data is as follows: α=0.10 H0: μ=73.2Ha: μ<73.2 σ=11.1M=71.8n=59
Q: Major League Baseball now records information about every pitch thrown in every game of every…
A: Given that: Population mean, μ=92.12 Population standard deviation, σ=2.43
Q: Three different methods for assembling a product were proposed by an industrial engineer. To…
A: Answer Given alpha = 0.05 SST =10800 SSTR =4550 three different methods =K =3. employees =30 =n…
Q: IS ale h measurement
A:
Q: Question 36: Based on the calculated test statistic, would you reject the null hypothesis…
A: The data is given on times they were absent in the subsequent year. Let μ be the population mean…
Q: 8. Suppose a small retail business owner is interested in assessing the normality of the daily sales…
A: Hi thank you for posting this question, since you have posted multiple subparts as per our policy…
Q: You have a random sample of people. You conduct a hypothesis test to see if your sample's…
A: claim : p <0.30sample proportion ( p^ ) = 0.25p value = 0.20we have to intrpret meaning of p…
Q: An airline company is wondering how many of its customers are children. Specifically, the company is…
A: Given that: The null and alternative hypotheses: H0:p≤0.05H1:p>0.05
Q: This question is intended to assess your use of relative frequencies and Bayes theorem, and your use…
A: Given that, Test A is a relatively cheap but unreliable test for trying to detect oil. Let A = Test…
Q: Frequency 9 8 7 LD 6 In D w 2 1 0 Height of students [Select] 114 115 116 117 811 2222221 20 Height…
A: The answer is -
Q: n 1997 Fuller and coworkers at Texas A&M University estimated the operating costs of cotton gin…
A: In 1997 Fuller and coworkers at Texas A&M University estimated the operating costs of cotton gin…
Q: The table represents a series of observed values for a paired-samples t test. Degrees of One-Tailed…
A: Given , Sample size = n = 31 It is paired two-tailed test. Significance level = α = 0.05
Q: A school has 3 math classes, each with 25 students, and 2 science classes, each with 30 students. If…
A:
Bb1.


Trending now
This is a popular solution!

Step by step
Solved in 3 steps

- ClairLinx Wireless, a start-up cell phone company, has divided its market of potential customers into three major groups: single, working; married, working; and retired. ClairLinx surveyed 500 potential customers and asked each, "Of the following, which do you consider to be the most important feature in a cell phone service plan: free nights and weekends, free long distance and roaming, or free calls to customers with the same company?" Each of the 500 potential customers in the survey was categorized according to the service plan feature she considers most important and the customer group in which she appears. The data are summarized in the contingency table below. In the cells of the table are the respective observed frequencies, and three of the cells also have blanks. Fill in these blanks with the frequencies expected if the two variables, type of potential customer and choice of service plan feature, are independent. Round the responses to at least two decimal places. Note:…ClairLinx Wireless, a start-up cell phone company, is trying to decide if it should market specific phone service plans to specific groups of customers. ClairLinx divides its market of potential customers into three major groups: single, working; married, working; and retired. ClairLinx surveyed 500 potential customers (chosen at random) and asked each, "Of the following, which do you consider to be the most important feature in a cell phone service plan: free nights and weekends, free long distance and roaming, or free calls to customers with the same company?" So, there are two variables being considered: type of potential customer ("single, working"; "married, working"; or "retired") and choice of service plan feature ("free calls to other customers", "free nights and weekends", or "free long-distance and roaming"). Each of the 500 potential customers in the survey was categorized according to the service plan feature she considers most important and the customer group in which…Much of the world's diamond industry is located in Africa, with Russia and Canada also showing large revenues from their diamond mining industry. A visual representation of the various shares of the world’s diamond revenues, adapted from Time Magazine,15 is shown below:See Attachmenta. Draw a pie chart to describe the various shares of the world’s diamond revenues.b. Draw a bar chart to describe the various shares of the world’s diamond revenues.c. Draw a Pareto chart to describe the various shares of the world’s diamond revenues.d. Which of the charts is the most effective in describing the data?
- Dr. B has begun collecting survey data from students for his research study about handwashing practices of college students. At the same time, the IRB has just started reviewing his research study application. Dr. B has abided by IRB protocol by having the IRB review his application during the data collection process. Group of answer choices True FalseWhat does Tukey’s test supplies?Economist Arthur Laffer suggests that beyond a certain point, high tax rates depress the economy so much that they actually reduce tax revenues. He proposed tax reductions as a means of stimulating the economy and, as a result, increase tax revenues. In the mid 1990’s Time magazine reported that 30% of the US Congress supported a tax cut as a means of stimulating the economy and increasing tax revenues. Suppose at that time 5 members of congress were randomly selected for an interview and asked whether they supported a tax cut to stimulate the economy. 1.2) Find the probability that at least three of the five members of congress who were interviewed were in favour of a tax cut (rounded off to four decimals).
- A nonprofit organization conducted a survey of 2040 metropolitan-area teachers regarding their beliefs about problems that hamper students' schooling. The following data were obtained. 850 said that lack of parental support is a problem. 850 said that abused or neglected children are problems. 660 said that malnutrition or students in poor health is a problem. 110 said that lack of parental support and abused or neglected children are problems. 100 said that lack of parental support and malnutrition or poor health are problems. 130 said that abused or neglected children and malnutrition or poor health are problems. 20 said that lack of parental support, abuse or neglect, and malnutrition or poor health are problems. What is the probability that a teacher selected at random from this group said that lack of parental support is the only problem hampering students' schooling? Hint: Draw a Venn diagram. (Round your answer to three decimal places.)In a Gallup telephone survey conducted on April 9–10, 2013, the person being interviewedwas asked if he would vote for a law in his state that would increase the gas tax up to20 cents a gallon, with the new gas tax money going to improve roads and bridges andbuild more mass transportation in his state. Possible responses were vote for, vote against,and no opinion. Two hundred ninety five respondents said they would vote for the law,672 said they would vote against the law, and 51 said they had no opinion (Gallup website,June 14, 2013).a. Do the responses for this question provide categorical or quantitative data?b. What was the sample size for this Gallup poll?In a Gallup telephone survey conducted on April 9–10, 2013, the person being interviewedwas asked if he would vote for a law in his state that would increase the gas tax up to20 cents a gallon, with the new gas tax money going to improve roads and bridges andbuild more mass transportation in his state. Possible responses were vote for, vote against,and no opinion. Two hundred ninety five respondents said they would vote for the law,672 said they would vote against the law, and 51 said they had no opinion (Gallup website,June 14, 2013).a. Do the responses for this question provide categorical or quantitative data?b. What was the sample size for this Gallup poll?c. What percentage of respondents would vote for a law increasing the gas tax?d. Do the results indicate general support for or against increasing the gas tax to improveroads and bridges and build more mass transportation?
- wat is the intermdiate demond of the agricultural,manufacutring,and energy sectorCounty school buses are inspected every month for “defects.” In a recent monthly inspection, 27 worn or tornseats were found, 22 buses had dirty floors, there were14 cases of exterior scratches and chipped paint, therewere 8 cracked or broken windows, the engines on 4buses had trouble starting or were not running smoothly,and 2 buses had faulty brakes. Develop a Pareto chart forthe bus inspections and indicate the most significantquality-problem categories. What does this tell you aboutthe limitations of applying Pareto chart analysis. Howmight these limitations be overcome in Pareto chartanalysis?The television show NBC Sunday Night Football broadcast a game between the Coltsand Patriots received a share of 22, meaning that among the TV sets in use, 22% were tuned to thegame (based on Nielson data). An advertiser wants to obtain a second opinion by conducting itsown survey, and a pilot survey begins with 33 households having TV sets in use at the time of thatsame NBC Sunday Night Football broadcast.Find P(X≤6)=?


