Discussing the Data - Class Average vs Group 9. Use the % change my group for the unknown a. Square the spot on the best fit line that shows the sucrose concentration of the unknown. b. What is the sucrose concentration of the unknown? c. Did you get the same answer as in 3b? 10. Many times when there are differences in data it is caused by small errors made when setting up the lab, collecting data or processing the data. List 2 sources where an error could have been made.
Discussing the Data - Class Average vs Group 9. Use the % change my group for the unknown a. Square the spot on the best fit line that shows the sucrose concentration of the unknown. b. What is the sucrose concentration of the unknown? c. Did you get the same answer as in 3b? 10. Many times when there are differences in data it is caused by small errors made when setting up the lab, collecting data or processing the data. List 2 sources where an error could have been made.

Biomedical Instrumentation Systems
1st Edition
ISBN:9781133478294
Author:Chatterjee
Publisher:Chatterjee
Chapter9: Instrumentation In Blood Circulation
Section: Chapter Questions
Problem 12P

Related questions
Question
Most answers a filled in, fill in the rest for the assig
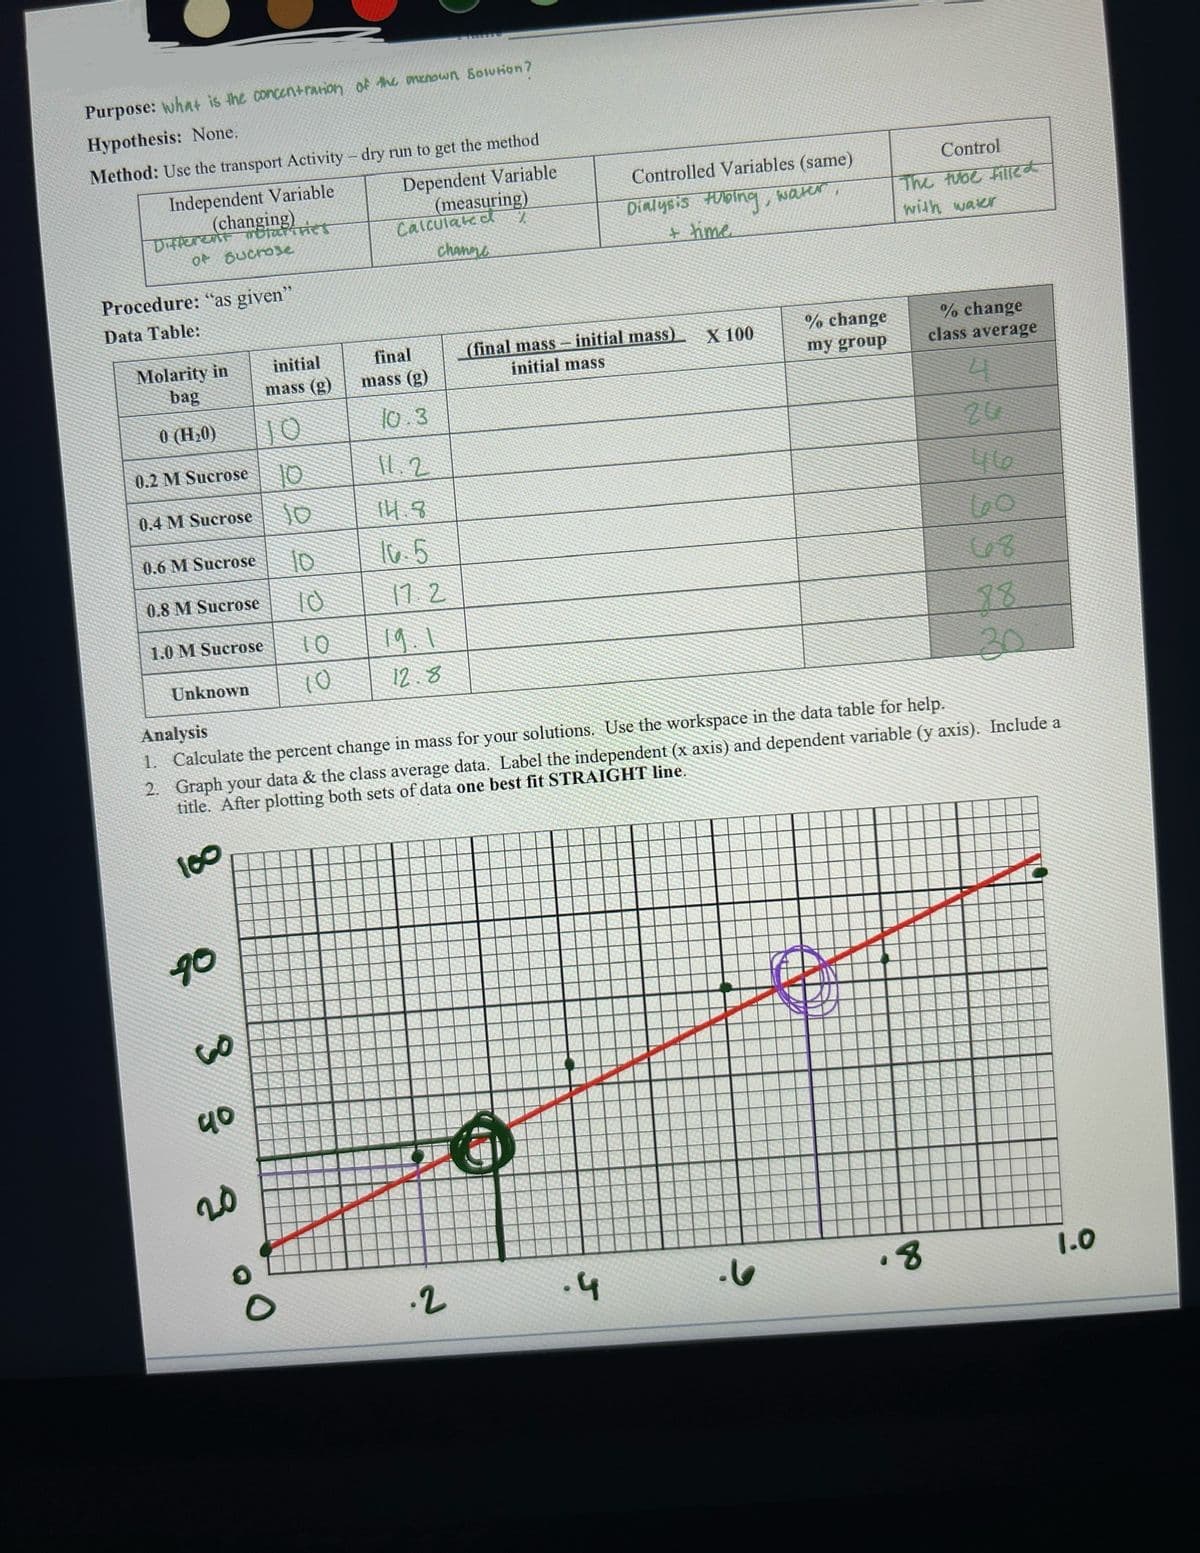
Transcribed Image Text:Purpose: what is the concentration of the menown Solution?
Hypothesis: None.
Method: Use the transport Activity - dry run to get the method
Independent Variable
Dependent Variable
(measuring)
(changing)
Different molarities
of sucrose
Procedure: "as given"
Data Table:
Molarity in
bag
0 (H₂0)
0.2 M Sucrose
0.4 M Sucrose
0.6 M Sucrose
0.8 M Sucrose
1.0 M Sucrose
Unknown
90
38
40
initial
mass (g)
20
10
10
10
10
Calculated
channe
final
mass (g)
10.3
11.2
14.8
10.5
17.2
12.8
.2
Controlled Variables (same)
Dialysis tubing,
+ time.
(final mass-initial mass)
initial mass
.4
X 100
water
% change
my group
Analysis
1. Calculate the percent change in mass for your solutions. Use the workspace in the data table for help.
2. Graph your data & the class average data. Label the independent (x axis) and dependent variable (y axis). Include a
title. After plotting both sets of data one best fit STRAIGHT line.
100
Control
The tube filled
with water
D
% change
class average
4
.8
46
68
30
1.0
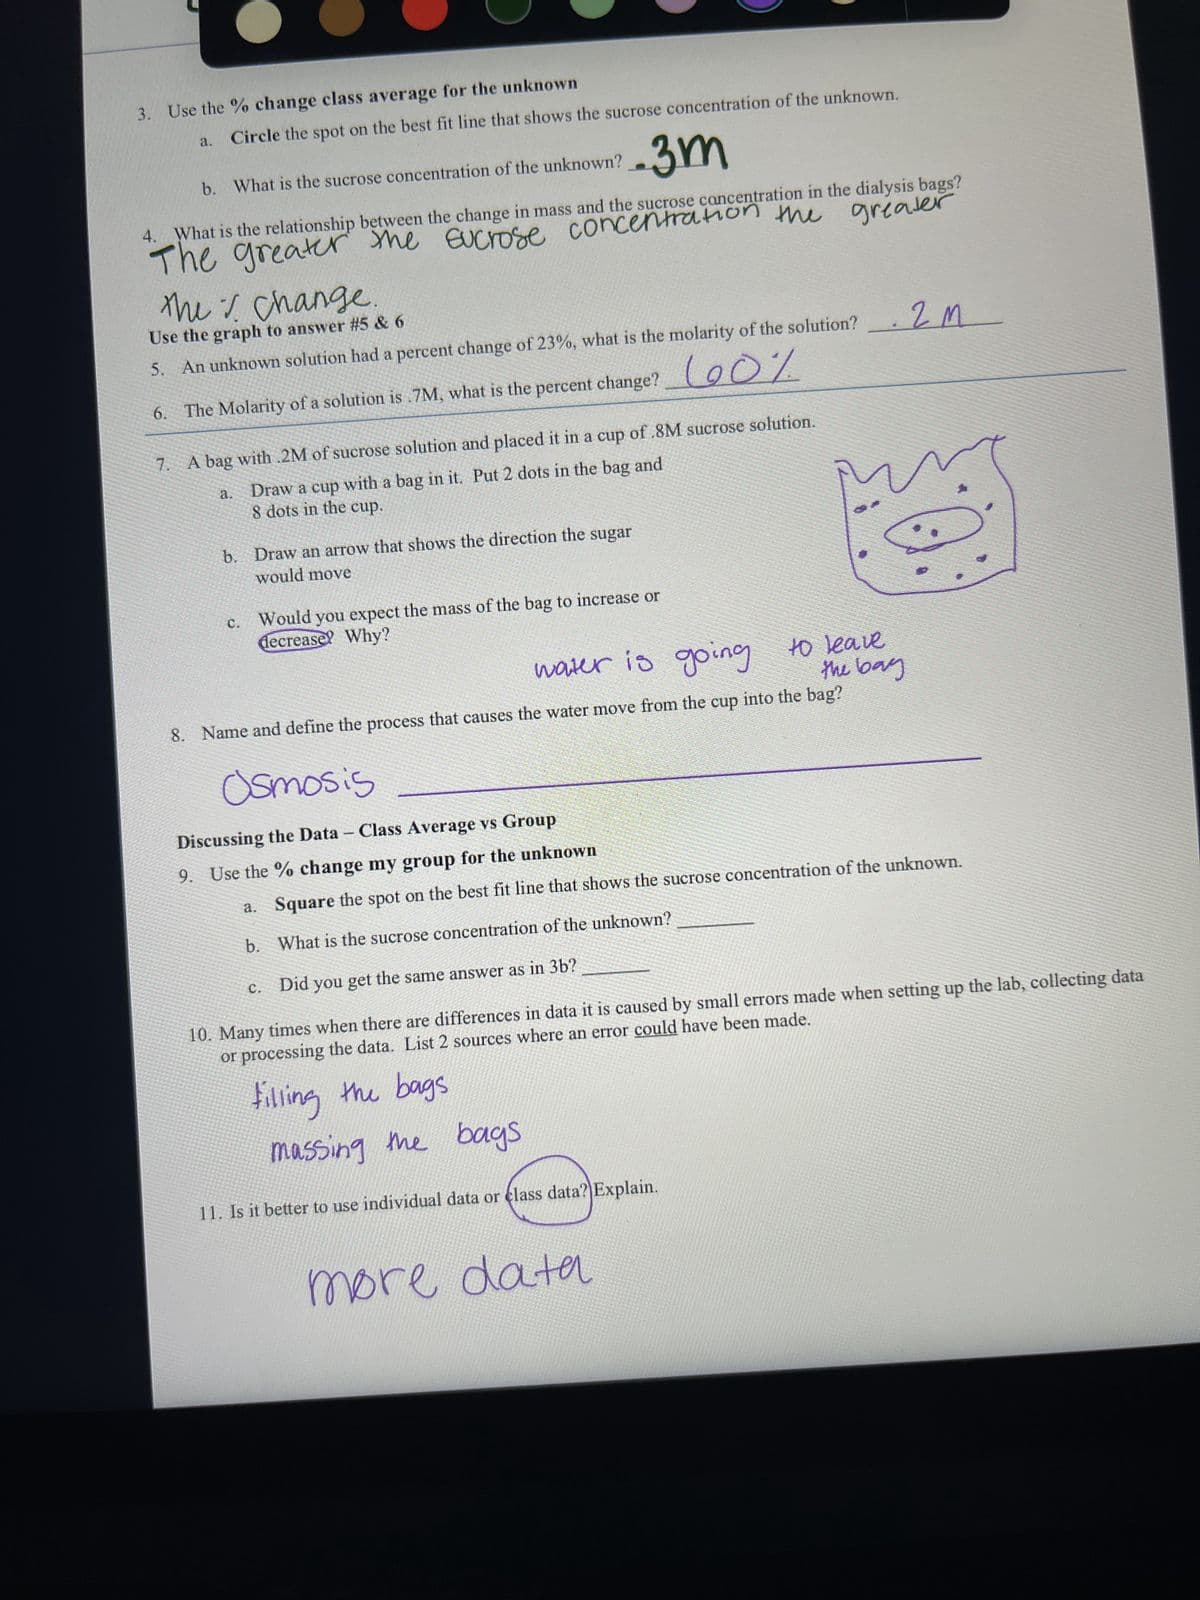
Transcribed Image Text:3. Use the % change class average for the unknown
a. Circle the spot on the best fit line that shows the sucrose concentration of the unknown.
.3m
4. What is the relationship between the change in mass and the sucrose concentration in the dialysis bags?
The greater the sucrose concentration the greater
b. What is the sucrose concentration of the unknown?
the ✓ Change.
Use the graph to answer # 5 & 6
5. An unknown solution had a percent change of 23%, what is the molarity of the solution? 2M
6. The Molarity of a solution is .7M, what is the percent change?
90%
7. A bag with .2M of sucrose solution and placed it in a cup of .8M sucrose solution.
Draw a cup with a bag in it. Put 2 dots in the bag and
8 dots in the cup.
b. Draw an arrow that shows the direction the sugar
would move
C.
Would you expect the mass of the bag to increase or
decrease? Why?
water is going
to leave
the bay
8. Name and define the process that causes the water move from the cup into the bag?
Osmosis
Discussing the Data - Class Average vs Group
9. Use the % change my group for the unknown
a. Square the spot on the best fit line that shows the sucrose concentration of the unknown.
b.
What is the sucrose concentration of the unknown?
10. Many times when there are differences in data it is caused by small errors made when setting up the lab, collecting data
or processing the data. List 2 sources where an error could have been made.
filling the bags
massing the bags
11. Is it better to use individual data or class data? Explain.
C.
you get the same answer as in 3b?
Did
more data
Expert Solution
This question has been solved!
Explore an expertly crafted, step-by-step solution for a thorough understanding of key concepts.

Step by step
Solved in 3 steps with 1 images

Recommended textbooks for you