Discussion Questions 1. Is the relationship a positive or a negative one? Explain how you can tell and what this means in terms of weight and fuel efficiency. 2. Interpret the slope of the least squares line in terms of weight and fuel efficiency. 3. Predict the fuel efficiency of a vehicle that weighs 4000 pounds. Include units.
Discussion Questions 1. Is the relationship a positive or a negative one? Explain how you can tell and what this means in terms of weight and fuel efficiency. 2. Interpret the slope of the least squares line in terms of weight and fuel efficiency. 3. Predict the fuel efficiency of a vehicle that weighs 4000 pounds. Include units.

Linear Algebra: A Modern Introduction
4th Edition
ISBN:9781285463247
Author:David Poole
Publisher:David Poole
Chapter4: Eigenvalues And Eigenvectors
Section4.6: Applications And The Perron-frobenius Theorem
Problem 22EQ

Related questions
Question
Discussion questions only please
Transcribed Image Text:4
R
F
V
%
5
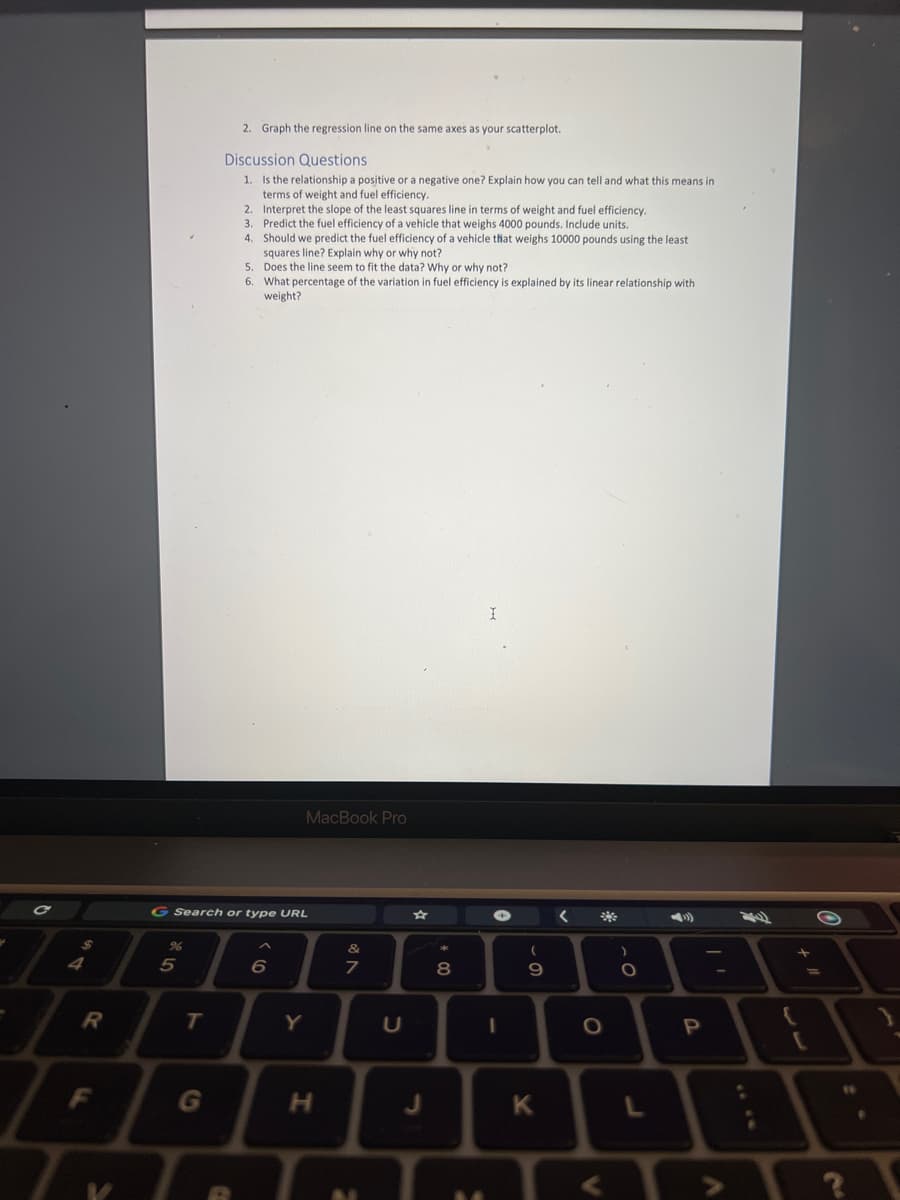
2. Graph the regression line on the same axes as your scatterplot.
Discussion Questions
1.
Is the relationship a positive or a negative one? Explain how you can tell and what this means in
terms of weight and fuel efficiency.
T
Interpret the slope of the least squares line in terms of weight and fuel efficiency.
Predict the fuel efficiency of a vehicle that weighs 4000 pounds. Include units.
Should we predict the fuel efficiency of a vehicle that weighs 10000 pounds using the least
squares line? Explain why or why not?
5.
Does the line seem to fit the data? Why or why not?
6. What percentage of the variation in fuel efficiency is explained by its linear relationship with
weight?
G Search or type URL
2.
3.
4.
(0
6
MacBook Pro
Y
H
V RO
7
M
U
J
*
8
00
→
I
(
-0
9
K
<
O
)
ɔ.
O
P
<>
L
E
O
11
?
Transcribed Image Text:3
E
$
R
F
V
%6
5
T
G
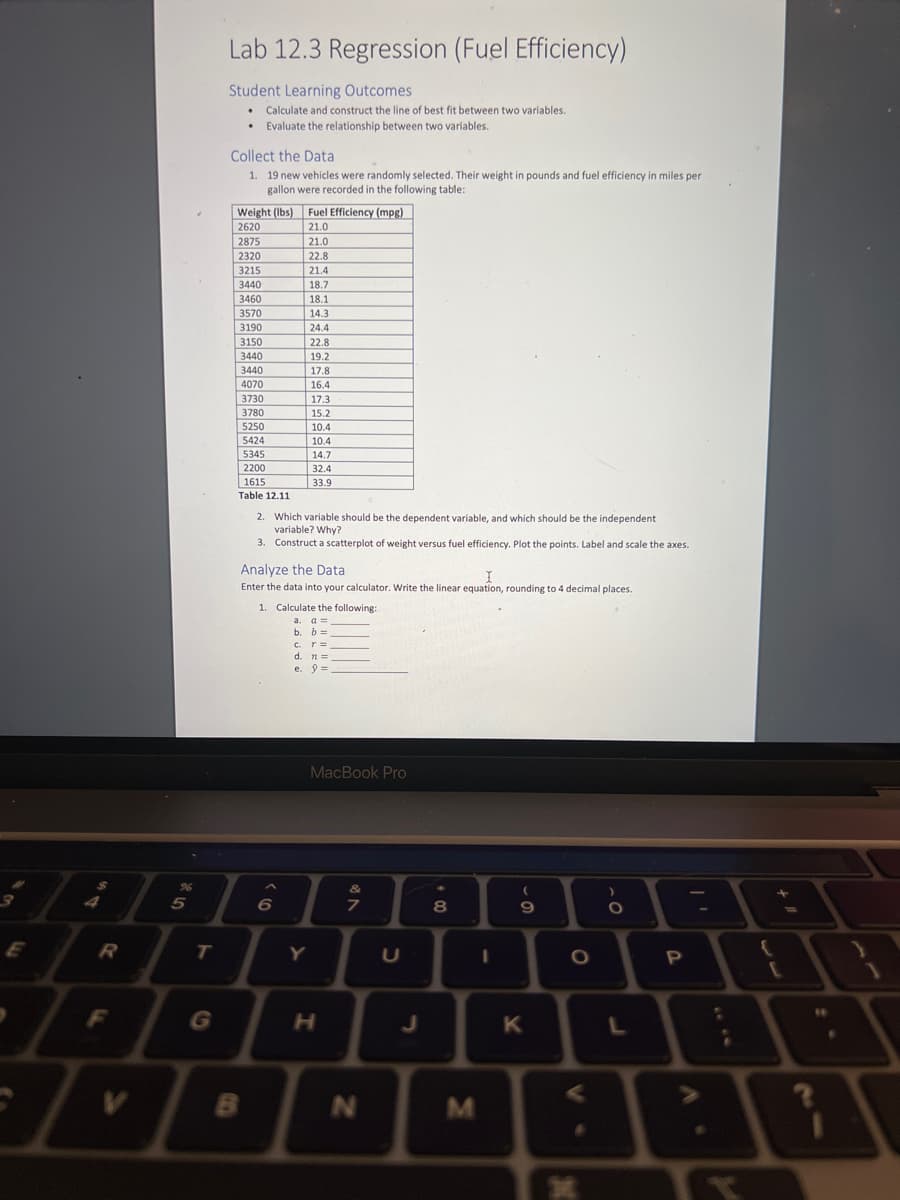
Lab 12.3 Regression (Fuel Efficiency)
Student Learning Outcomes
• Calculate and construct the line of best fit between two variables.
• Evaluate the relationship between two variables.
Collect the Data
1. 19 new vehicles were randomly selected. Their weight in pounds and fuel efficiency in miles per
gallon were recorded in the following table:
Weight (lbs) Fuel Efficiency (mpg)
2620
21.0
2875
2320
3215
3440
3460
3570
3190
3150
3440
3440
4070
3730
3780
5250
5424
5345
2200
1615
Table 12.11
B
21.0
22.8
21.4
18.7
18.1
14.3
24.4
22.8
2. Which variable should be the dependent variable, and which should be the independent
variable? Why?
3. Construct a scatterplot of weight versus fuel efficiency. Plot the points. Label and scale the axes.
Analyze the Data
I
Enter the data into your calculator. Write the linear equation, rounding to 4 decimal places.
19.2
17.8
16.4
17.3
15.2
10.4
10.4
14.7
32.4
33.9
6
1. Calculate the following:
a. a =
b.
b =
C. T =
d. n =
e. 9=
Y
MacBook Pro
H
&
7
N
U
J
8
M
I
(
9
K
O
V
*
O
L
P
:
;
+
tell
[
16
●
1
Expert Solution
This question has been solved!
Explore an expertly crafted, step-by-step solution for a thorough understanding of key concepts.

This is a popular solution!

Trending now
This is a popular solution!

Step by step
Solved in 5 steps with 1 images

Recommended textbooks for you
Linear Algebra: A Modern Introduction
Algebra
ISBN:
9781285463247
Author:
David Poole
Publisher:
Cengage Learning

College Algebra
Algebra
ISBN:
9781305115545
Author:
James Stewart, Lothar Redlin, Saleem Watson
Publisher:
Cengage Learning

Algebra and Trigonometry (MindTap Course List)
Algebra
ISBN:
9781305071742
Author:
James Stewart, Lothar Redlin, Saleem Watson
Publisher:
Cengage Learning
Linear Algebra: A Modern Introduction
Algebra
ISBN:
9781285463247
Author:
David Poole
Publisher:
Cengage Learning
College Algebra
Algebra
ISBN:
9781305115545
Author:
James Stewart, Lothar Redlin, Saleem Watson
Publisher:
Cengage Learning
Algebra and Trigonometry (MindTap Course List)
Algebra
ISBN:
9781305071742
Author:
James Stewart, Lothar Redlin, Saleem Watson
Publisher:
Cengage Learning

Big Ideas Math A Bridge To Success Algebra 1: Stu…
Algebra
ISBN:
9781680331141
Author:
HOUGHTON MIFFLIN HARCOURT
Publisher:
Houghton Mifflin Harcourt


Functions and Change: A Modeling Approach to Coll…
Algebra
ISBN:
9781337111348
Author:
Bruce Crauder, Benny Evans, Alan Noell
Publisher:
Cengage Learning