MATLAB: An Introduction with Applications
6th Edition
ISBN: 9781119256830
Author: Amos Gilat
Publisher: John Wiley & Sons Inc
expand_more
expand_more
format_list_bulleted
Question
Data for questions:
Mean :6.54
Standard Deviation:1.842
Sample size :50
Significance Level 0.05
Please explain what each mean

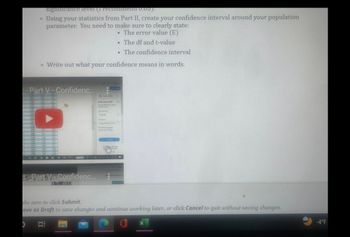
Transcribed Image Text:significance level (1 recommend 0.05).
Using your statistics from Part II, create your confidence interval around your population
parameter. You need to make sure to clearly state:
The error value (E)
▪ The df and t-value
I The confidence interval
o Write out what your confidence means in words.
O
- Part V-Confidenc...
INK
.
ts-Part V-Confidenc...
THE PER
H
Export P
Sto
Top Cha
■
ake sure to click Submit.
ave as Draft to save changes and continue working later, or click Cancel to quit without saving changes.
>
B
-4°F
Expert Solution
This question has been solved!
Explore an expertly crafted, step-by-step solution for a thorough understanding of key concepts.
Step by stepSolved in 2 steps

Follow-up Questions
Read through expert solutions to related follow-up questions below.
Follow-up Question
This data comes from the hours of sleep among nightshift and dayshift workers. How would i put into words the
Solution
by Bartleby Expert
Follow-up Questions
Read through expert solutions to related follow-up questions below.
Follow-up Question
This data comes from the hours of sleep among nightshift and dayshift workers. How would i put into words the
Solution
by Bartleby Expert
Knowledge Booster
Similar questions
- Calculate the range, variance and standard deviation for the following sample data. Scores: 10, 7, 9, 1, 2, 0, 6arrow_forwardA primary measure of dispersion for sample data is the sample standard deviation, s. Choose the best option to explain what the meaning of the sample standard deviation is, in general. A. The distance between one observation and the mean. B. The average distance of an observation from the middle of the distribution. C. The average distance between observations in the sample. D. The distance between the third and first quartiles.arrow_forwardName: ID: B 14. Is the sample mean, calculated from a random sample, an unbiased estimator of the population mean? Explain.arrow_forward
- Please answerarrow_forwardopen file attached for questionarrow_forwardA sample of the lifetime of an electrical component is given bellow, in number of hours: 123, 116, 122, 110, 210, 126, 125, 111, 118, 117 Calculate the sample mean and sample median for these lifetimes. Sample Mean 127.8 Sample Median 120 Can you explain why these two measures of location are so different? Submit Questionarrow_forward
- What is the correct way to report the results in APA stylearrow_forwardCalculation of a mean is most appropriate for which of the following sets of data? Attitudes of graduate nurses toward the elderly measured by axillary temperature Ranking of nursing students by clinical instructors according to perceived technical ability. Percent of nurses in each specialty area.arrow_forwardCalculate the below for the following data set: {5, 7, 9, 1, 2, 3, 4, 6}, Round to the nearest hundredth. Mean Sum of Squares Variance Standard Deviationarrow_forward
arrow_back_ios
arrow_forward_ios
Recommended textbooks for you
 MATLAB: An Introduction with ApplicationsStatisticsISBN:9781119256830Author:Amos GilatPublisher:John Wiley & Sons Inc
 Probability and Statistics for Engineering and th...StatisticsISBN:9781305251809Author:Jay L. DevorePublisher:Cengage Learning
 Statistics for The Behavioral Sciences (MindTap C...StatisticsISBN:9781305504912Author:Frederick J Gravetter, Larry B. WallnauPublisher:Cengage Learning
 Elementary Statistics: Picturing the World (7th E...StatisticsISBN:9780134683416Author:Ron Larson, Betsy FarberPublisher:PEARSON
 The Basic Practice of StatisticsStatisticsISBN:9781319042578Author:David S. Moore, William I. Notz, Michael A. FlignerPublisher:W. H. Freeman
 Introduction to the Practice of StatisticsStatisticsISBN:9781319013387Author:David S. Moore, George P. McCabe, Bruce A. CraigPublisher:W. H. Freeman

MATLAB: An Introduction with Applications
Statistics
ISBN:9781119256830
Author:Amos Gilat
Publisher:John Wiley & Sons Inc

Probability and Statistics for Engineering and th...
Statistics
ISBN:9781305251809
Author:Jay L. Devore
Publisher:Cengage Learning

Statistics for The Behavioral Sciences (MindTap C...
Statistics
ISBN:9781305504912
Author:Frederick J Gravetter, Larry B. Wallnau
Publisher:Cengage Learning

Elementary Statistics: Picturing the World (7th E...
Statistics
ISBN:9780134683416
Author:Ron Larson, Betsy Farber
Publisher:PEARSON

The Basic Practice of Statistics
Statistics
ISBN:9781319042578
Author:David S. Moore, William I. Notz, Michael A. Fligner
Publisher:W. H. Freeman

Introduction to the Practice of Statistics
Statistics
ISBN:9781319013387
Author:David S. Moore, George P. McCabe, Bruce A. Craig
Publisher:W. H. Freeman