Distribution of Full-Time Salaries: Class of 2007 18 16 14 12 10 6. 4 Annual Salary (in Dollars) Percentage of Salaries 2. 10,000 35,000 60,000 85,000 110,000 135,000 000'09 000


Q: A manufacturing company is analyzing its accident record. The accidents fall into two categories:…
A: From the given information, the accident falls into two categories: Minor and majorAverage cost for…
Q: Using the information shown below calculate the overall index of the cost of college attendance for…
A: Solution
Q: What is the crude mortality rate? Age-Group 65 Population Number of Deaths 15,000 20 17,000 55 6,000…
A: The given information is summarized in the following table: Age-Group Population Number of deaths…
Q: In predicting a person’s income, identify two possible quantitative predictor variables and two…
A:
Q: Dixie Showtime Movie Theaters, Inc., owns and operates a chain of cinemas in several markets in the…
A: Hello! As you have posted more than 3 sub parts, we are answering the first 3 sub-parts(regression…
Q: stration 8,6. Table 8.6 gives the net domestic product by in- dustry of origin as a percentage…
A:
Q: The LawnPlus Fertilizer Company distributes fertilizer tovarious lawn and garden shops. The company…
A: Since you have posted a question with multiple sub-parts, we will solve first 3 sub-parts for you.…
Q: Industry Sectors Service Trade and Transporation Total sector United States Total Employment 68%…
A: Percentage change for Services: Percentage for 2010 is 68 and for 2020 it is 69% Hence Percentage…
Q: Year 1915 1920 1925 1930 1935 1940 1945 1950 1955 Rate 3.1 2.2 5.3 7.5 8.5 7.4 10.3 22.1 17.6…
A: “Since you have asked multiple questions, we will solve the first question for you. If you want any…
Q: Phillip Cane, the managing editor of Your Life Magazine, needs to develop a forecasting system for…
A: The moving average method is an improvement over semi average method as short term fluctuation are…
Q: Palisades Eco-Park is a small ecological reserve that admits a relatively small number of visitors…
A: a) Excel Procedure: Enter Visitors and Labor cost data in Excel Go to Data Select Data Analysis…
Q: 19. The following data describes the export quantity of a company. Year: 1995 1996 1997 1998 1999…
A:
Q: 2.Tuition Fees: The following table shows the average annual tuition and fees at private and public…
A: The correlation coefficient and the least square line can be found using the technology. First make…
Q: Socially conscious investors screen out stocks of alcohol and tobacco makers, firms with poor…
A: Since you have posted a question with multiple subparts, we will solve the first three complete…
Q: 1. Age of person (in years) Weight (in kg) aj 16 17 11 12 13 14 15 40 42 38 35 45 51 48 b. Trend…
A: Scatterplot is used to represent the two numerical variable. It helps to determine the association…
Q: Stock Performance Decade Performance(%) 1830s 2.8 1840s 12.8 1850s 6.6 1860s 12.5…
A: Hello. Since your question has multiple sub-parts, we will solve first three sub-parts for you. If…
Q: 14. A Private bank want to know whether their mortgage rate is in line with the data history of…
A: Introduction: As the manager wishes to use a simple linear analysis to determine whether the…
Q: Calculate 5-yearly weighted moving averages for the following data, using the weights 1.1, 3, 2, 1,…
A: IN THE ABOVE GIVEN PROBLEM WE HAVE TO CALCULATE THE 5 YEAR WEIGHTED MOVING AVERAGES
Q: 3.9 Kenya 55 380 2.9 6.8 Indonesia 35 530 4.1 3.4 Panama 30 1910 3.1 8.6 Chile 25…
A: Country Birth rate GNP Growth Income ratio Bangladesh 47 140 0.3 2.3 Tanzania 47 280 1.9 3.2…
Q: Year Gross Federal Debt ($millions) 1945 260,123 1950 256,853 1955 274,366 1960…
A:
Q: Year Quarters Stock % 2012 1 29.8 2012 2 31 2012 3
A: Here is the percentage of stocks in a typical portfolio in eight quarters of 2012 to 2013 is…
Q: Nixie Showtime Movie Theaters, Inc., owns and operates a chain of cinemas in several markets in the…
A: According to the answering guidelines, we can answer only three subparts of a question and the rest…
Q: Activity I: Exploratory Data Analysis Use the following data set to calculate the measures that…
A: As per guidelines we will only answer first three subparts, please repost other subparts for more…
Q: insider the following data representing the price of refrigerators (in dollars). 1260, 1446, 1106,…
A: Given data: 1260, 1446, 1106, 1269, 1443, 1424, 1118, 1132, 1177, 1115, 1156, 1262, 1215, 1236,…
Q: 11. The number of units of a product exported during 1990-97 is given below. Fit a straight line…
A:
Q: Cell phone subscribers Year Top U.S. law firms gross revenue (in million dolları (in thousands) 1989…
A: Let us consider the numbers of Cell phone subscribers (in thousands) to be X and the Top U.S. law…
Q: (b) The sales for soca CDs at a music store follows a seasonal pattern with a trend. The following…
A: Thanks for giving opportunity to serve for bartleby students, Hey, There ! Thank you for posting…
Q: A survey in 2020 among adult bike travelers revealed the following age structure: Age group 18 to…
A: a) b)
Q: .Tuition Fees: The following table shows the average annual tuition and fees at private and public…
A: Given, The following table shows the average annual tuition and fees at private and public 4-year…
Q: Considering the actual demand values below for LCD TVs sold by a retailer per month, what is the…
A: The following information has been provided: Month Demand 1 42 2 40 3 43 4 40 5 41…
Q: The maximum discount value of the Entertainment® card for the "Fine Dining" section for various…
A: part(e): Step-by-step procedure to find the sample correlation coefficient using Excel: In Excel…
Q: Dixie Showtime Movie Theaters, Inc., owns and operates a chain of cinemas in several markets in the…
A: (a) The dependent variable is weekly gross revenue and the independent variable is amount of…
Q: Dixie Showtime Movie Theaters, Inc., owns and operates a chain of cinemas in several markets in the…
A: Given Information: Weekly Gross revenue Television advertising Newspaper Advertising 101.3 5.0…
Q: Exercise 2. Value of Education. The following table shows median annual earnings (in 2011) for women…
A: Given: Men with a bachelor's degree earn = 66196 Women with a bachelor's degree earn = 49108
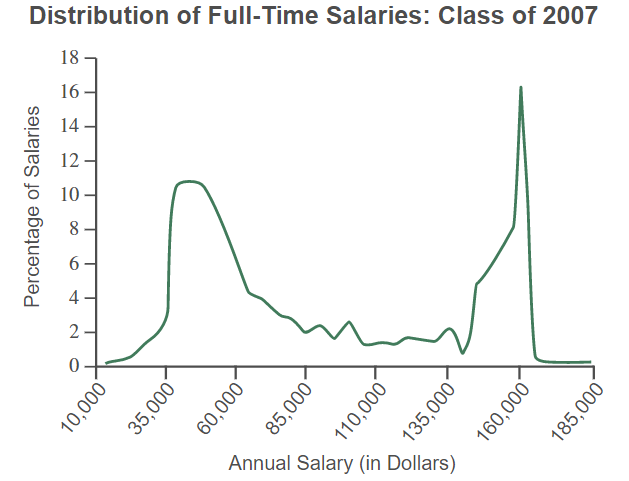
Q: i need help on parts a,b and c.
A: a)In general, the histogram shows the shape of the distribution.From the given histogram, it can be…
Q: 2.1 Display Data 84. Table 2.63 contains the 2010 obesity rates in U.S. states and Washington, DC.…
A: Given : Alabama 32.2 Kentucky 31.3 North Dakota 27.2 Alaska 24.5 Louisiana 31.0 Ohio 29.2 Arizona…
Q: Dixie Showtime Movie Theaters, Inc., owns and operates a chain of cinemas in several markets in the…
A: Given data indicates weekly gross revenue as a function of advertising expenditures for a sample of…
Q: Dixie Showtime Movie Theaters, Inc., owns and operates a chain of cinemas in several markets in the…
A: Given Information: The owners would like to estimate weekly gross revenue as a function of…
Q: ales 75 77 69 63 79 80 77 70 73 87 72 73 80 80 69 84 77 72 74 81 temperature…
A: Hi, since the question has multiple parts. As per the guidelines i am obliged to answer first three…
Q: recent week follow. Market Weekly Gross Revenue ($100s) Television Advertising ($100s)…
A:
Q: Dixie Showtime Movie Theaters, Inc., owns and operates a chain of cinemas in several markets in the…
A: Given :
Q: Using three yearly moving averages, determine the trend and short term. fluctuations. Year : 1989…
A:
Q: Charlie Corporation's managers in the stamping department have been studying the overhead cost and…
A: Given information: Month Overhead Machine hours January 5,030 2,730 February 1,600 600…
Q: The following table provides age-specific male and female population of a country. a) Draw the…
A:
Q: Socially conscious investors screen out stocks of alcohol and tobacco makers, firms with poor…
A: It is given that the sample size is 36, the sample mean is 17.8 and the standard deviation is 5.8.…
Q: Tuition Fees: The following table shows the average annual tuition and fees at private and public…
A: Year(x) Private(Y) x2 y2 xy 1 31448 1 988976704 31448 2 32617 4 1063868689 65234 3 33674 9…
Q: 4. One method to estimate the causal effect of education on income based on the Vietnam draft…
A:
Q: 1. A researcher intends to determine the monthly expenditure of households in Puncak Alam. The…
A: “Since you have posted a question with multiple sub-parts, we will solve first three subparts for…
Q: Example 35. Calculate Median and Mode for the following distribution: Production per day (in Tons):…
A:
Q: Hoping to diversify suppliers, a manufacturer buys the same component from three sources, with 24%…
A:

Consider the sampling distribution of the sample means created from this population for


Trending now
This is a popular solution!

Step by step
Solved in 2 steps with 1 images


- Prenatal care Results of a 1996 American MedicalAssociation report about the infant mortality rate fortwins carried for the full term of a normal pregnancy areshown on the next page, broken down by the level ofprenatal care the mother had received.a) Is the overall rate the average of the other three rates?Should it be? Explain.b) Do these results indicate that adequate prenatal careis important for pregnant women? Explain.c) Do these results suggest that a woman pregnant withtwins should be wary of seeking too much medicalcare? Explain.Joint distributionSales of a particular product for the years 2017 through 2020 have been 390, 455, 432 and 487 respectively. What sales would you predict for 2021 using a weighted moving average with weights of 0.45 for the immediate preceding year and 0.3, 0.15 and 0.1 for the three years before that?
- Blue Reef makes diving suits in 4 sizes: S, M, L and XL. Its best selling model, the Pufferfish, often commands high demand. However, for the sake of maintaining diversity in the product line, the firm reserves just 7500 units of its production capacity to this model. Based on last year’s experience, management expects that demand for each size this summer will follow a Normal distribution with the characteristics below. Size Mean Std Dev S 1700 600 M 2600 850 L 2100 950 XL 1500 500 How many units of each size of Pufferfish should Blue Reef make? Answer Size Qty S M L XLCorrelation • Between FDI Inflows and ManufacturingEmpty Stomachs. In the publication “How Often Do Fishes ‘Run on Empty’?” (Ecology, Vol. 83, No 8, pp. 2145–2151), D. Arrington et al. examined almost 37,000 fish of 254 species from the waters of Africa, South and Central America, and North America to determine the percentage of fish with empty stomachs. The fish were classified as piscivores (fish-eating), invertivores (invertibrateeating), omnivores (anything-eating) and algivores/detritivores (eating algae and other organic matter). For those fish in African waters, the data on theWeissStats site give the proportions of each species of fish with empty stomachs. At the 1% significance level, do the data provide sufficient evidence to conclude that a difference exists in the mean percentages of fish with empty stomachs among the four different types of feeders? a. conduct a one-way ANOVA test on the data. b. interpret your results from part (a). c. decide whether presuming that the assumptions of normal populations and equal…
- Construct a relative frequency marginal distribution. x1 x2 x3 Relative frequency marginal distribution y1 30 25 30 enter your response here y2 30 15 50 enter your response here Relative frequency marginal distribution enter your response here enter your response here enter your response here 1 (Round to three decimal places as needed.)A vending machine dispenses hot chocolate or coffee. Service time is 30 seconds per cup and is constant. Customers arrive at a mean rate of 67 per hour, and this rate is Poisson-distributed. a. Determine the average number of customers waiting in line. (Round your answer to 2 decimal places.) Average number of customer 0.35 b. Determine the average time customers spend in the system. (Do not round intermediate calculations. Round your answer to 2 decimal places.) Average time minutes c. Determine the average number of customers in the system. (Do not round intermediate calculations. Round your answer to 2 decimal places.) Average number customersAt noon time, customers arrive at Metrobank counter managed by a single cashier with mean arrival rate of 6 customers per hour. The cashier attends the customers on first come first served basis at 10 customers per hour.What is the waiting time of a customer in the system?
- Researchers wanted to determine if carpeted rooms contained more bacteria than uncarpeted rooms. To determine the amount of bacteria in a room, researchers pumped the air from the room over a Petri dish at the rate of 1 cubic foot per minute for eight carpeted rooms and eight uncarpeted rooms. Colonies of bacteria were allowed to form in the 16 Petri dishes. The results are given in the table below. Assume the distribution to be approximately normal. Do carpeted rooms have more bacteria than uncarpeted rooms? Carpeted Rooms Uncarpeted Rooms 11.7 12.0 8.2 8.3 7.1 3.8 13.1 7.3 10.6 12.0 10.1 11.1 14.8 10.3 14.0 13.7 What is the test statistic for this hypothesis test if group 1 is the carpeted rooms and group 2 is the uncarpeted rooms. 1.43 2.73 0.1831 1.39 0.935Researchers wanted to determine if carpeted rooms contained more bacteria than uncarpeted rooms. To determine the amount of bacteria in a room, researchers pumped the air from the room over a Petri dish at the rate of 1 cubic foot per minute for eight carpeted rooms and eight uncarpeted rooms. Colonies of bacteria were allowed to form in the 16 Petri dishes. The results are given in the table below. Assume the distribution to be approximately normal. Do carpeted rooms have more bacteria than uncarpeted rooms? Carpeted Rooms Uncarpeted Rooms 11.7 12.0 8.2 8.3 7.1 3.8 13.1 7.3 10.6 12.0 10.1 11.1 14.8 10.3 14.0 13.7 What is the critical value(s) for this hypothesis test if group 1 is the carpeted rooms and group 2 is the uncarpeted rooms. 1.895 2.306 2.365 1.833 1.860Thickness measurements of a coating process are made to the nearest hundredth of a millimeter. The thickness measurements are uniformly distributed with values 0.15, 0.16, 0.17, 0.18, and 0.19. Determine the mean and variance of the coating thickness for this process.
