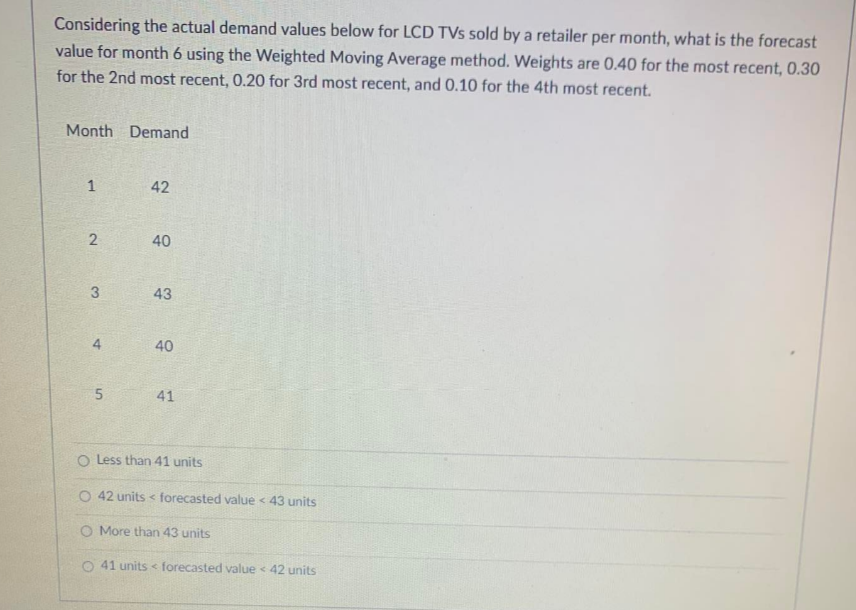
Considering the actual demand values below for LCD TVs sold by a retailer per month, what is the forecast value for month 6 using the Weighted Moving Average method. Weights are 0.40 for the most recent, 0.30 for the 2nd most recent, 0.20 for 3rd most recent, and 0.10 for the 4th most recent. Month Demand 1 42 2 3 4 40 43 40 5 41 O Less than 41 units O 42 units forecasted value < 43 units O More than 43 units 41 units forecasted value < 42 units


Q: Based on the data shown below, calculate the regression line (each value to two decimal places) y =…
A: Use the Excel and Perform the Regression. Followings are the Steps to perform the Regression 1) Open…
Q: Suppose that a researcher is interested in the average standardized test score for fifth graders in…
A:
Q: When tossing 4 coins, if an event represents the appearance of at most 3 pictures, then 4 is: HHHH (…
A: We know, Probability = Favorable outcomes /total outcomes For flip of 4 coins Total possible…
Q: Suppose that a random sample of 16 adult U.S. males has a mean height of 70 inches with a standard…
A: Given : Sample Size, n = 16 Sample Mean, x̄ = 70 sample standard…
Q: 4.6 4.6 4.4 4.5 4.3 4.7 4.9 4.6 4.6 4.6 4.5 4.7 4.5 4.5 4.6 4.6 4.6 4.8 1. Use the ungrouped data…
A: (a) The objective is to arrange the data into equal classes.
Q: Below is the frequency distribution of the recorded weights in kilograms of the Grade 7 students at…
A: We have given that, Class interval frequency (f) 44 - 46 4 41 - 43 13 38 - 40 16 35 -…
Q: Assume that the U.S Open Golf Tournament was played at Congressional Country club, with prizes…
A:
Q: Identify the value corresponding to the indicated percentile. A tire company finds the lifespan for…
A: The question is about normal dist. Given : Mean lifespan for tires ( μ ) = 47500 miles Std.…
Q: 1. The heights of the freshmen at STI College are supposed to follow a normal distribution with a μ…
A: It is given that Sample mean = 160 Standard deviation = 10 Sample size = 36
Q: n uses simple exponential smoothing with trend adjustment to forecast dema 0.4" and "=0.3". The…
A:
Q: A grocery store had 10 cartons of milk, 2 of which are strawberry flavored. If you are going to buy…
A: Given A grocery store had 10 cartons of milk, 2 of which are strawberry flavored. If you are going…
Q: If New York City has a mean gasoline price of $307 with a standard deviation of $19; while Hawaii…
A: Given that: Mean and standard deviation of New York City: μ1=307σ1=19 Mean and standard deviation of…
Q: B. Direction: Consider the number of hours per week spent by 50 students playing computer games.…
A: Solution: Interval f x fx (x-x) x-x fx-x (x-x)2 f(x-x)2 44 - 40 2 42 84 15.6 15.6 31.2 243.36…
Q: oming election. To help with this estimate, the staffer surveyed a small group of likely voters and…
A: Given : Margin of error: ME = 0.045
Q: The claim is that the proportion of adults who smoked a cigarette in the past week is less than 0.25…
A: Given,n=1908x=439p^=xnp^=4391908=0.2301
Q: A musicologist is currently writing a report about pop songs in the late 2010s. As a part of his…
A: Given that: Sample size, n = 155 Sample mean, x¯=3.01 Population standard deviation, σ=0.3
Q: You are working at a sandwich shop and recently became the owner. You want to make sure that the…
A: Given that, μ = 50 σ = 5 Data : X 42 41 53 41 47 57 36
Q: A road transport company has one reservation clerk on duty at a time. He handles information of bus…
A: The question is about queuing model Given : Customer arrival rate ( λ ) = 8 per hour Average service…
Q: The regression equation to predict the total world gross ticket sales from the opening weekend…
A: The regression equation to predict the total world gross ticket sales from the opening weekend…
Q: Can smoking negatively affect one's ability to become pregnant? A study collected data on 654 women…
A: Given Total number of women
Q: We want to conduct a hypothesis test of the claim that for middle-aged adults the population mean of…
A: Given: Hypothesized Mean (µ0) = 195.8 Sample mean is X = 190.8 Population…
Q: (a) The sample has size 10, and it is from a population with a distribution about which we know very…
A: Solution-: The sample has size 10, and it is from a population with a distribution about which we…
Q: 2. The mean age of 30 student volunteers in a community pantry is 17.5 year standard deviation of 2…
A: The mean age of 30 student is 17.5 with standard deviation 2 years n=30x=17.5s=2At 99% confidence…
Q: 2. The weights, in grams, of ten bags of popcorn are shown below 91, 101, 98, 98, 103, 97, 102, 105,…
A:
Q: Question 7: You wish to test the following claim (HaHa) at a significance level of α=0.10α=0.10.…
A:
Q: Let x be a random variable with a mass probability function given in the following table: 1 0 -1 X…
A: Solution-: We have following table: X P(X) 1 1/2 0 1/3 -1 k We want to check…
Q: One population has a mean of u = 50 and a standard deviation of a = 15, and a different population…
A: Solution. The given data repersent the mean and SD of two curve.
Q: In a job fair, 5,000 applicants applied for a job. Their mean age was found to be 28 with a standard…
A: As per our guidelines we can solve first three sub part of question and rest can be reposted.…
Q: The Energy Star rating system is an energy efficiency program run by the U.S. Environmental…
A: Null and alternative hypotheses: Null hypothesis: Null hypothesis is a statement which is tested for…
Q: Question 25: You are conducting a study to see if the proportion of men over the age of 50 who…
A: The following information is provided: The sample size is n = 767 sample proportion is = =…
Q: You run a regression analysis on a bivariate set of data (n 103). With = 24.3 and y = 75.9, you…
A: Givenn=103x = 24.3y = 75.9Regression equation is y=0.659x+59.886Correlation coefficient(r)=0.883
Q: 14. What is the sum of the squared deviations from the mean? a. 20 b. 18 c. 15 d. 10 15. The…
A: The frequency distribution table is as follows: Class interval Frequency Class mark Xi Lower…
Q: The number of orders received daily by an online vendor of used CDs is normally distributed with…
A: Let X be the number of orders received daily
Q: Eleven regions in the Congolese rain forest are randomly sampled. In each region rainfall was…
A:
Q: Use the standard normal distribution to find P(-2.25 < z < 0). 0.6831 0.5122 0.4878 0.0122
A: Given,P(-2.25<Z<0)
Q: A survey was conducted that asked 1008 people how many books they had read in the past year. Results…
A: Given X-bar=11.8 S=16.6
Q: A power company is installing utility poles that are supposed to have a height of 40 feet. The…
A: Use the Excel and calculate the Sample Mean and Sample Standard deviation
Q: Critical values for quick reference during this activity. Confidence level Critical value 0.90…
A: Solution-: Given: n=1000, x=351, c=0.95 We want to find 95% C.I.?
Q: The price of the ordinary N25 shares of Manco plc quoted on the Stock Exchange at the close of…
A: Given data indicates the rice of the ordinary N25 shares of Manco plc quoted on the Stock Exchange…
Q: psychologist would like to estimate the proportion of Americans that say "the future of the nation…
A: It is given that the sample size (n) is 917 and the sample proportion is 0.732.
Q: HO:200 H1: µ>200 Where variance known, what is the P-value for the following test statistics…
A: a) Given : Sample Size , n= 100 Sample Mean , x̄ =104.5 population standard…
Q: tion 16: According to a University Center for Logistics Management, 4% of all merchandise sold in…
A: Given data,Population proportion is p=4%=0.04Sample Proportion is P' =589=0.0562Test statistic z=?
Q: A production engineer collected a sample of 14 parts to measure their weights. The sample mean was…
A: Given that, n= 14, mean =8.48kg, sigma=0.79kg We have to find 95% lower confidence bound.
Q: Find k such that the function is a probability density function over the given interval. Then write…
A: Given,f(x)=kx ; 1≤x≤8
Q: An urban community wants to show that the incidence of breast cancer is higher in their locality…
A: Hi! Thank you for the question, As per the honor code, we are allowed to answer three sub-parts at a…
Q: Last year, 47% of business owners gave a holiday gift to their employees. A survey of business…
A:
Q: Test B. Directions: Complete the table below by supplying the missing entries Item No. Description…
A: The objective is to give the description, symbol, and formula for each of the given items.
Q: Use the data in the following table, which lists drive-thru order accuracy at popular fast food…
A:
Q: X₁, X2,...,xn is a random sample from the population that follows a Poisson distribution with the…
A: Given information: Given x1, x2, x3,................... xnis a random sample from the population…
Q: Indicate whether or not the first researcher’s position is supported by the results.
A: here given , Angel believes a coin is “fair,” the other believes the coin is biased toward heads.…

Step by step
Solved in 2 steps

- Data collected on the yearly demand for 50-pound bags of fertilizer at Wallace Garden Supply are shown in the following table: YEAR DEMAND FOR FERTILIZER (1,000S OF BAGS) 1 4 2 6 3 4 4 5 5 10 6 8 7 7 8 9 9 12 10 14 11 15 a) Develop a trend line for the demand for fertilizer using any computer software? b) For these three forecasts, 3-year moving average, a weighted moving average, and a trend line, which one would you use? Explain your answer?The LawnPlus Fertilizer Company distributes fertilizer tovarious lawn and garden shops. The company must base itsquarterly production schedule on a forecast of how manytons of fertilizer will be demanded from it. The companyhas gathered the following data for the past three yearsfrom its sales records. a. Compute a three-quarter moving average forecast forquarters 4 through 13 and compute the forecast errorfor each quarter.b. Compute a five-quarter moving average forecast forquarters 6 through 13 and compute the forecast errorfor each quarter.c. Compute a weighted three-quarter moving averageforecast using weights of 0.50, 0.33, and 0.17 for the most recent, next recent, and most distant data, respec-tively, and compute the forecast error for each quarter. d. Compare the forecasts developed in parts (a), (b), and(c) using cumulative error. Which forecast appears tobe most accurate? Do any exhibit any bias?4) the accompanying dataset provides data on monthly unemployment rates for a certain region over four years. Compare 3- and 12- month moving average forecast using the MAD criterion. Which of the two models yields better results? (See picture) Find the MAD for the 3 month moving average forcast. MAD = _____
- During the past five months the emergency room at the new district Hospital has observed the number of patients during the weekend (Friday through Sunday). They typically experience greater patient traffic on weekends than during the week. WEEK NO. OF PATIENTS 1 105 2 119 3 122 4 128 5 117 6 136 7 141 8 126 9 143 10 140 a) Compute a weighted three-period moving average forecast, using weights of 3, 2, and 1 for the most recent, next recent, and most distant data. b) What are the MAD, MSE and the MPE for this method? c) If the company decided to forecast using exponential smoothing with value of alpha =.3, what is the forecast in month 11? (use 2 decimal places)ZIMS store sells its products on installments in Karachi. The store decided to investigate the link between the life of the product and the cost. The data collected from store is shown in Table 1.1:Table 1.1LIFE OF PRODUCT (Years) COST (Thousand Rupees)3.0 253.5 284.0 324.5 345.0 343.0 305.5 404.5 404.0 423.5 426.0 507.5 508.0 538.5 55a) Plot a scatter chart from the above data.b) Find the equation of the least square regression line in the form ? = ? + ??. Given the value of ? ??? ? up to 3 decimal places. c) What are the exact interpretations of the estimated regression factors? d) Using your answer of part (b). Find the cost predicted by the regression line for ?. ? year’s life of a product.Suppose there are three fare classes in an airline fares p1 = $300, p2 = $200, and p3 = $100. You want to utilize the EMSR-b heuristic to calculate the protection level for classes 1 and 2 together. The demand distribution for class 1 is Normal with mean 50 and standard deviation 5. The demand distribution for class 2 is Normal with mean 75 and standard deviation 12. What is the price for the virtual class 1-2 under EMSR-b?
- Floyd Distributors, Inc., provides a variety of auto parts to small local garages. Floyd purchases parts from manufacturers according to the EOQ model and then ships the parts from a regional warehouse direct to its customers. For a particular type of muffler, Floyd's EOQ analysis recommends orders with Q* = 20 to satisfy an annual demand of 180 mufflers. Floyd's has 250 working days per year, and the lead time averages 15 days.Note: Use Appendix B to identify the areas for the standard normal distribution. What is the reorder point if Floyd assumes a constant demand rate? If required, round your answer up to the nearest whole number. r = fill in the blank 1 Suppose that an analysis of Floyd's muffler demand shows that the lead-time demand follows a normal probability distribution with µ = 12 and σ = 2.2. If Floyd's management can tolerate one stock-out per year, what is the revised reorder point? If required, round your answer up to the nearest whole number. r = fill in the blank…Suppose these data show the number of gallons of gasoline sold by a gasoline distributor in Bennington, Vermont, over the past 12 weeks. Week Sales (1,000sof gallons) 1 17 2 21 3 19 4 24 5 18 6 16 7 21 8 19 9 22 10 21 11 16 12 23 *PLEASE REFER TO ATTACHED IMAGE FOR DATA! PART 1.Compute four-week and five-week moving averages for the time series. PART 2. Compute the MSE for the four-week moving average forecasts. (Round your answer to two decimal places.) PART 3.Compute the MSE for the five-week moving average forecasts. (Round your answer to two decimal places.)GreenLawns provides a lawn fertilizing and weed control service. The company is adding a special aeration treatment as a low-cost extra service option, which it hopes will help attract new customers. Management is planning to promote this new service in two media: radio and direct-mail advertising. A media budget of $4,000 is available for this promotional campaign. Based on past experience in promoting its other services, GreenLawns has obtained the following estimate of the relationship between sales and the amount spent on promotion in these two media: S = -2R2 − 12M2 − 9RM + 20R + 39M, Where S = total sales in thousands of dollars R = thousands of dollars spent on radio advertising M = thousands of dollars spent on direct-mail advertising GreenLawns would like to develop a promotional strategy that will lead to maximum sales subject to the restriction provided by the media budget. (a) What is the value of sales if $3,000 is spent on radio advertising and $1,000 is…
- ZIMS store sells its products on installments in Karachi. The store decided to investigate the link between the life of the product and the cost. The data collected from store is shown in Table 1.1Table 1.1LIFE OF PRODUCT (Years) COST (Thousand Rupees)3.0 253.5 284.0 324.5 345.0 343.0 305.5 404.5 404.0 423.5 426.0 507.5 508.0 538.5 55a) Plot a scatter chart from the above data.b) Find the equation of the least square regression line in the form ? = ? + ??Given the value of a and b up to 3 decimal places. c) What are the exact interpretations of the estimated regression factors? d) Using your answer of part (b). Find the cost predicted by the regression line for 6.5 year’s life of a product.A credit card company deals with many hundreds of thousands of transactions everyweek. One of its measures of the quality of service it gives its customers is the dependabilitywith which it mails customers’ monthly accounts. The quality standard it sets itself is thataccounts should be mailed within two days of the ‘nominal post date’ which is specified to thecustomer. Every week the company samples 1,000 customer accounts and records the percentagewhich was not mailed within the standard time. When the process is working normally, only 2per cent of accounts are mailed outside the specified period, that is, 2 per cent are‘defective’Required:Find the control limits and interpret the process conformance.Given the following data for demand at Southern Industries Ltd, calculate the forecast forperiods 4-10 using a 3 -period weighted moving average. The weight of 0.5, 0.3 and 0.2are assigned to the most recent period respectively. Determine the MAD, (mean absolutedeviation). Assume the control limit for the tracking signal is ± 5. Is this a good forecast? Period Demand Forecast Error MAD1 742 903 594 915 1406 987 1108 1239 99 10 112