Do female college students spend more time thán male college students watching TV? This was one of the questions investigated by the authors of an article. Each student in a random sample of 46 male students at a university in England and each student in a random sample of 38 female students from the same university kept a diary of how he or she spent time over a three-week period. A USE SALT For the sample of males, the mean time spent watching TV per day was 68.3 minutes and the standard deviation was 67.5 minutes. For the sample of females, the mean time spent watching TV per day was 93.8 minutes and the standard deviation was 89.1 minutes. Is there convincing evidence that the mean time female students at this university spend watching TV is greater than the mean time for male students? Test the appropriate hypotheses using a = 0.05. (Use males - Hfemales Round your test statistic to one decimal place, your df down to the nearest whole number, and your P-value to three decimal places.) t=-15 df = 82 P-value= 0.070 State your conclusion. O Fail to reject Hg. We have convincing evidence that the mean time female students at this university spend watching TV is greater than the mean time for male students. O Reject Hg. We do not have convincing evidence that the mean time female students at this university spend watching TV is greater than the mean time for male students. O Reject Hg. We have convincing evidence that the mean time female students at this university spend watching TV is greater than the mean time for male students. O Fail to reject Hg. We do not have convincing evidence that the mean time female students this university spend watching TV is greater than the mean time for male students.
Do female college students spend more time thán male college students watching TV? This was one of the questions investigated by the authors of an article. Each student in a random sample of 46 male students at a university in England and each student in a random sample of 38 female students from the same university kept a diary of how he or she spent time over a three-week period. A USE SALT For the sample of males, the mean time spent watching TV per day was 68.3 minutes and the standard deviation was 67.5 minutes. For the sample of females, the mean time spent watching TV per day was 93.8 minutes and the standard deviation was 89.1 minutes. Is there convincing evidence that the mean time female students at this university spend watching TV is greater than the mean time for male students? Test the appropriate hypotheses using a = 0.05. (Use males - Hfemales Round your test statistic to one decimal place, your df down to the nearest whole number, and your P-value to three decimal places.) t=-15 df = 82 P-value= 0.070 State your conclusion. O Fail to reject Hg. We have convincing evidence that the mean time female students at this university spend watching TV is greater than the mean time for male students. O Reject Hg. We do not have convincing evidence that the mean time female students at this university spend watching TV is greater than the mean time for male students. O Reject Hg. We have convincing evidence that the mean time female students at this university spend watching TV is greater than the mean time for male students. O Fail to reject Hg. We do not have convincing evidence that the mean time female students this university spend watching TV is greater than the mean time for male students.

MATLAB: An Introduction with Applications
6th Edition
ISBN:9781119256830
Author:Amos Gilat
Publisher:Amos Gilat
Chapter1: Starting With Matlab
Section: Chapter Questions
Problem 1P

Related questions
Topic Video
Question
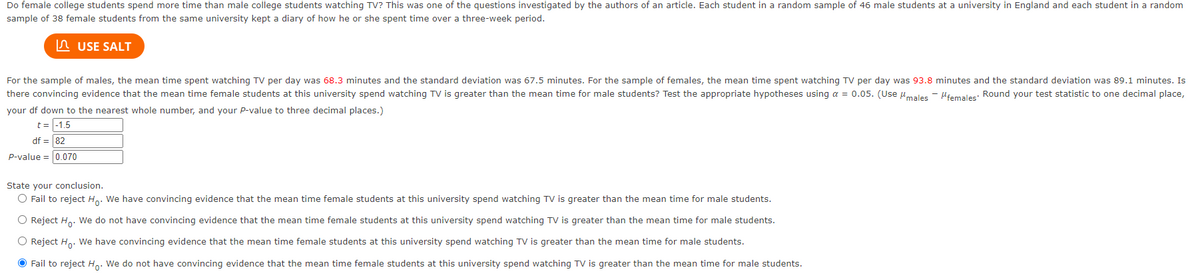
Transcribed Image Text:Do female college students spend more time than male college students watching TV? This was one of the questions investigated by the authors of an article. Each student in a random sample of 46 male students at a university in England and each student in a random
sample of 38 female students from the same university kept a diary of how he or she spent time over a three-week period.
n USE SALT
For the sample of males, the mean time spent watching TV per day was 68.3 minutes and the standard deviation was 67.5 minutes. For the sample of females, the mean time spent watching TV per day was 93.8 minutes and the standard deviation was 89.1 minutes. Is
there convincing evidence that the mean time female students at this university spend watching TV is greater than the mean time for male students? Test the appropriate hypotheses using a = 0.05. (Use umales - Hiemales: Round your test statistic to one decimal place,
your df down to the nearest whole number, and your P-value to three decimal places.)
t = -1.5
df = 82
P-value = 0.070
State your conclusion.
O Fail to reject H,. We have convincing evidence that the mean time female students at this university spend watching TV is greater than the mean time for male students.
O Reject Ho. We do not have convincing evidence that the mean time female students at this university spend watching TV is greater than the mean time for male students.
O Reject Ho. We have convincing evidence that the mean time female students at this university spend watching TV is greater than the mean time for male students.
O Fail to reject H. We do not have convincing evidence that the mean time female students at this university spend watching TV is greater than the mean time for male students.
Expert Solution
This question has been solved!
Explore an expertly crafted, step-by-step solution for a thorough understanding of key concepts.

This is a popular solution!

Trending now
This is a popular solution!

Step by step
Solved in 4 steps

Knowledge Booster


Learn more about
Need a deep-dive on the concept behind this application? Look no further. Learn more about this topic, statistics and related others by exploring similar questions and additional content below.Recommended textbooks for you
MATLAB: An Introduction with Applications
Statistics
ISBN:
9781119256830
Author:
Amos Gilat
Publisher:
John Wiley & Sons Inc

Probability and Statistics for Engineering and th…
Statistics
ISBN:
9781305251809
Author:
Jay L. Devore
Publisher:
Cengage Learning

Statistics for The Behavioral Sciences (MindTap C…
Statistics
ISBN:
9781305504912
Author:
Frederick J Gravetter, Larry B. Wallnau
Publisher:
Cengage Learning
MATLAB: An Introduction with Applications
Statistics
ISBN:
9781119256830
Author:
Amos Gilat
Publisher:
John Wiley & Sons Inc
Probability and Statistics for Engineering and th…
Statistics
ISBN:
9781305251809
Author:
Jay L. Devore
Publisher:
Cengage Learning
Statistics for The Behavioral Sciences (MindTap C…
Statistics
ISBN:
9781305504912
Author:
Frederick J Gravetter, Larry B. Wallnau
Publisher:
Cengage Learning

Elementary Statistics: Picturing the World (7th E…
Statistics
ISBN:
9780134683416
Author:
Ron Larson, Betsy Farber
Publisher:
PEARSON

The Basic Practice of Statistics
Statistics
ISBN:
9781319042578
Author:
David S. Moore, William I. Notz, Michael A. Fligner
Publisher:
W. H. Freeman

Introduction to the Practice of Statistics
Statistics
ISBN:
9781319013387
Author:
David S. Moore, George P. McCabe, Bruce A. Craig
Publisher:
W. H. Freeman