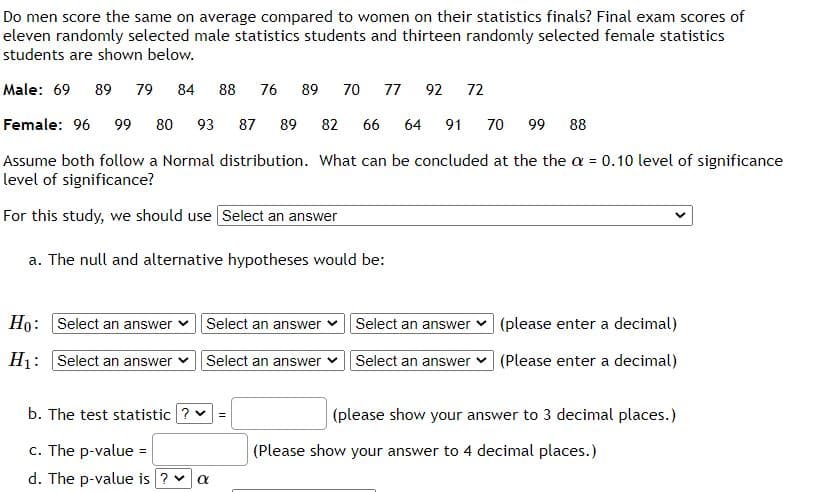
Do men score the same on average compared to women on their statistics finals? Final exam scores of eleven randomly selected male statistics students and thirteen randomly selected female statistics students are shown below. Male: 69 89 79 84 88 76 89 70 77 92 72 Female: 96 99 80 93 87 89 82 66 64 91 70 99 88 Assume both follow a Normal distribution. What can be concluded at the the a = 0.10 level of significance level of significance?
Do men score the same on average compared to women on their statistics finals? Final exam scores of eleven randomly selected male statistics students and thirteen randomly selected female statistics students are shown below. Male: 69 89 79 84 88 76 89 70 77 92 72 Female: 96 99 80 93 87 89 82 66 64 91 70 99 88 Assume both follow a Normal distribution. What can be concluded at the the a = 0.10 level of significance level of significance?

Glencoe Algebra 1, Student Edition, 9780079039897, 0079039898, 2018
18th Edition
ISBN:9780079039897
Author:Carter
Publisher:Carter
Chapter10: Statistics
Section10.4: Distributions Of Data
Problem 19PFA

Related questions
Question
Transcribed Image Text:Do men score the same on average compared to women on their statistics finals? Final exam scores of
eleven randomly selected male statistics students and thirteen randomly selected female statistics
students are shown below.
Male: 69
89
79
84
88
76
89
70
77
92
72
Female: 96
99
80
93
87
89
82
66
64
91
70
99
88
Assume both follow a Normal distribution. What can be concluded at the the a = 0.10 level of significance
level of significance?
%3D
For this study, we should use Select an answer
a. The null and alternative hypotheses would be:
Ho: Select an answer
Select an answer v Select an answer
(please enter a decimal)
H1: Select an answer
Select an answer
Select an answer (Please enter a decimal)
b. The test statistic ? v
(please show your answer to 3 decimal places.)
c. The p-value =
(Please show your answer to 4 decimal places.)
%3D
d. The p-value is ? v
Expert Solution
This question has been solved!
Explore an expertly crafted, step-by-step solution for a thorough understanding of key concepts.

This is a popular solution!

Trending now
This is a popular solution!

Step by step
Solved in 2 steps with 1 images

Knowledge Booster


Learn more about
Need a deep-dive on the concept behind this application? Look no further. Learn more about this topic, statistics and related others by exploring similar questions and additional content below.Recommended textbooks for you
Glencoe Algebra 1, Student Edition, 9780079039897…
Algebra
ISBN:
9780079039897
Author:
Carter
Publisher:
McGraw Hill
Glencoe Algebra 1, Student Edition, 9780079039897…
Algebra
ISBN:
9780079039897
Author:
Carter
Publisher:
McGraw Hill