Do test scores at pre-treatment differ from test scores at post-treatment? Note, this analysis should be conducted ignoring the treatment group they are in.
Do test scores at pre-treatment differ from test scores at post-treatment? Note, this analysis should be conducted ignoring the treatment group they are in.

Big Ideas Math A Bridge To Success Algebra 1: Student Edition 2015
1st Edition
ISBN:9781680331141
Author:HOUGHTON MIFFLIN HARCOURT
Publisher:HOUGHTON MIFFLIN HARCOURT
Chapter11: Data Analysis And Displays
Section: Chapter Questions
Problem 10CT

Related questions
Question
- Do test scores at pre-treatment differ from test scores at post-treatment? Note, this analysis should be conducted ignoring the treatment group they are in.
- Do male and female subjects differ on their pre-test score performance?
- Knowing the number of hours the student studied for the exam, can you predict their post-test scores?
- Is there a significant relationship between subject’s IQ and pre-test scores?
- Do the three treatments differ significantly from one another at pre-test?
- Do student IQ scores differ significantly from the population (μ = 100 & σ = 15)?
- Create your own research question based on the data.
(All analyses are to be tested at α =.05, two tailed)
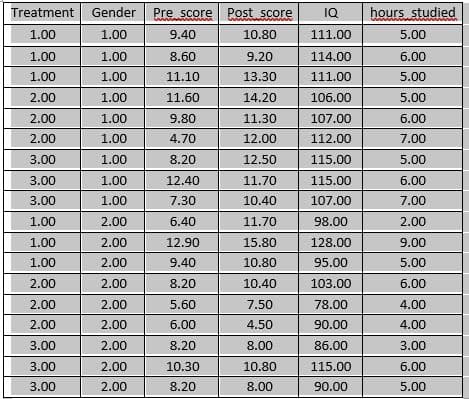
Transcribed Image Text:Treatment
Gender
Pre score Post score
IQ
hours studied
1.00
1.00
9.40
10.80
111.00
5.00
1.00
1.00
8.60
9.20
114.00
6.00
1.00
1.00
11.10
13.30
111.00
5.00
2.00
1.00
11.60
14.20
106.00
5.00
2.00
1.00
9.80
11.30
107.00
6.00
2.00
1.00
4.70
12.00
112.00
7.00
3.00
1.00
8.20
12.50
115.00
5.00
3.00
1.00
12.40
11.70
115.00
6.00
3.00
1.00
7.30
10.40
107.00
7.00
1.00
2.00
6.40
11.70
98.00
2.00
1.00
2.00
12.90
15.80
128.00
9.00
1.00
2.00
9.40
10.80
95.00
5.00
2.00
2.00
8.20
10.40
103.00
6.00
2.00
2.00
5.60
7.50
78.00
4.00
2.00
2.00
6.00
4.50
90.00
4.00
3.00
2.00
8.20
8.00
86.00
3.00
3.00
2.00
10.30
10.80
115.00
6.00
3.00
2.00
8.20
8.00
90.00
5.00
Expert Solution
This question has been solved!
Explore an expertly crafted, step-by-step solution for a thorough understanding of key concepts.

This is a popular solution!

Trending now
This is a popular solution!

Step by step
Solved in 2 steps with 7 images

Knowledge Booster


Learn more about
Need a deep-dive on the concept behind this application? Look no further. Learn more about this topic, statistics and related others by exploring similar questions and additional content below.Recommended textbooks for you
Big Ideas Math A Bridge To Success Algebra 1: Stu…
Algebra
ISBN:
9781680331141
Author:
HOUGHTON MIFFLIN HARCOURT
Publisher:
Houghton Mifflin Harcourt
Big Ideas Math A Bridge To Success Algebra 1: Stu…
Algebra
ISBN:
9781680331141
Author:
HOUGHTON MIFFLIN HARCOURT
Publisher:
Houghton Mifflin Harcourt