Do the poor spend less time in the shower than the rich? The results of a survey asking poor and rich people how many minutes they spend in the shower are shown below. Poor 37 9 22 30 7 40 8 11 27 7 Rich: 15 40 44 52 26 43 50 34 14 48 14 53 12 Assume both follow a Normal distribution. What can be concluded at the the a = 0.05 level of significance level of significance? For this study, we should use Select an answer a. The null and altemative hypotheses would be: Ho: Select an answer Select an answer Select an answer (please enter a decimal) H: Select an answer Select an answer Select an answer (Please enter a decimal) b. The test statistic (please show your answer to 3 decimal places.) c. The p-value = (Please show your answer to 4 decimal places.) d. The p-value is ?v a e. Based on this, we should Select an answer the null hypothesis. f. Thus, the final conclusion is that .. O The results are statistically insignificant at a = 0.05, so there is statistically significant evidence to conclude that the population mean time in the shower for the poor is equal to the population mean time in the shower for the rich. O The results are statistically significant at a = 0.05, so there is sufficient evidence to conclude that the population mean time in the shower for the poor is less than the population mean time in the shower for the rich. O The results are statistically insignificant at a = 0.05, so there is insufficient evidence to conclude that the population mean time in the shower for the poor is less than the population
Do the poor spend less time in the shower than the rich? The results of a survey asking poor and rich people how many minutes they spend in the shower are shown below. Poor 37 9 22 30 7 40 8 11 27 7 Rich: 15 40 44 52 26 43 50 34 14 48 14 53 12 Assume both follow a Normal distribution. What can be concluded at the the a = 0.05 level of significance level of significance? For this study, we should use Select an answer a. The null and altemative hypotheses would be: Ho: Select an answer Select an answer Select an answer (please enter a decimal) H: Select an answer Select an answer Select an answer (Please enter a decimal) b. The test statistic (please show your answer to 3 decimal places.) c. The p-value = (Please show your answer to 4 decimal places.) d. The p-value is ?v a e. Based on this, we should Select an answer the null hypothesis. f. Thus, the final conclusion is that .. O The results are statistically insignificant at a = 0.05, so there is statistically significant evidence to conclude that the population mean time in the shower for the poor is equal to the population mean time in the shower for the rich. O The results are statistically significant at a = 0.05, so there is sufficient evidence to conclude that the population mean time in the shower for the poor is less than the population mean time in the shower for the rich. O The results are statistically insignificant at a = 0.05, so there is insufficient evidence to conclude that the population mean time in the shower for the poor is less than the population

MATLAB: An Introduction with Applications
6th Edition
ISBN:9781119256830
Author:Amos Gilat
Publisher:Amos Gilat
Chapter1: Starting With Matlab
Section: Chapter Questions
Problem 1P

Related questions
Question
Quuestions: B, C, F
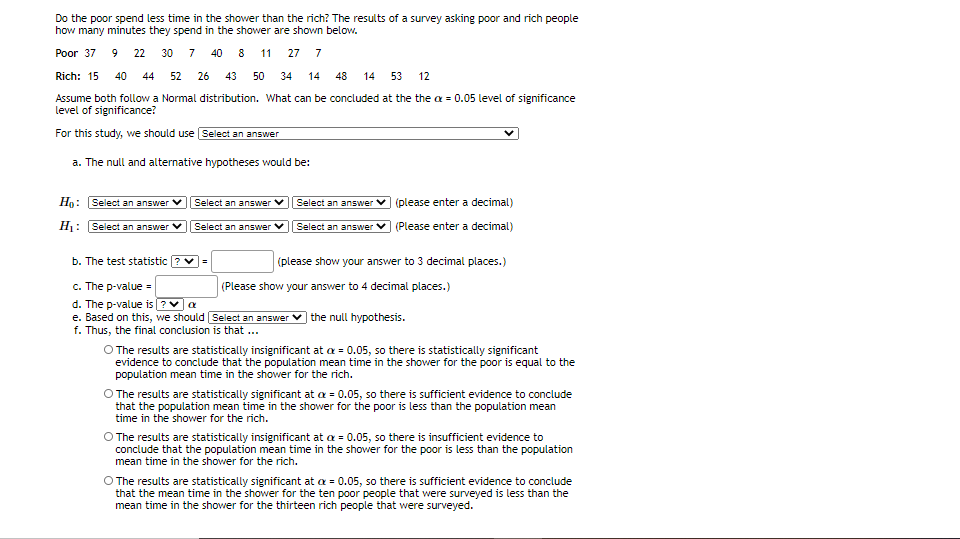
Transcribed Image Text:Do the poor spend less time in the shower than the rich? The results of a survey asking poor and rich people
how many minutes they spend in the shower are shown below.
Poor 37 9 22 30 7 40 8 11
27 7
Rich: 15
40
44
52
26 43 50
34
14
48
14
53
12
Assume both follow a Normal distribution. What can be concluded at the the a = 0.05 level of significance
level of significance?
For this study, we should use Select an answer
a. The null and alternative hypotheses would be:
Ho: Select an answer
Select an answer
Select an answer v (please enter a decimal)
H: Select an answer V
Select an answer V
Select an answer V
(Please enter a decimal)
b. The test statistic ? v=
(please show your answer to 3 decimal places.)
c. The p-value =
d. The p-value is ?va
(Please show your answer to 4 decimal places.)
e. Based on this, we should Select an answer
| the null hypothesis.
f. Thus, the final conclusion is that ...
O The results are statistically insignificant at a = 0.05, so there is statistically significant
evidence to conclude that the population mean time in the shower for the poor is equal to the
population mean time in the shower for the rich.
O The results are statistically significant at a = 0.05, so there is sufficient evidence to conclude
that the population mean time in the shower for the poor is less than the population mean
time in the shower for the rich.
O The results are statistically insignificant at a = 0.05, so there is insufficient evidence to
conclude that the population mean time in the shower for the poor is less than the population
mean time in the shower for the rich.
O The results are statistically significant at a = 0.05, so there is sufficient evidence to conclude
that the mean time in the shower for the ten poor people that were surveyed is less than the
mean time in the shower for the thirteen rich people that were surveyed.
Expert Solution
This question has been solved!
Explore an expertly crafted, step-by-step solution for a thorough understanding of key concepts.

This is a popular solution!

Trending now
This is a popular solution!

Step by step
Solved in 2 steps

Knowledge Booster


Learn more about
Need a deep-dive on the concept behind this application? Look no further. Learn more about this topic, statistics and related others by exploring similar questions and additional content below.Recommended textbooks for you
MATLAB: An Introduction with Applications
Statistics
ISBN:
9781119256830
Author:
Amos Gilat
Publisher:
John Wiley & Sons Inc

Probability and Statistics for Engineering and th…
Statistics
ISBN:
9781305251809
Author:
Jay L. Devore
Publisher:
Cengage Learning

Statistics for The Behavioral Sciences (MindTap C…
Statistics
ISBN:
9781305504912
Author:
Frederick J Gravetter, Larry B. Wallnau
Publisher:
Cengage Learning
MATLAB: An Introduction with Applications
Statistics
ISBN:
9781119256830
Author:
Amos Gilat
Publisher:
John Wiley & Sons Inc
Probability and Statistics for Engineering and th…
Statistics
ISBN:
9781305251809
Author:
Jay L. Devore
Publisher:
Cengage Learning
Statistics for The Behavioral Sciences (MindTap C…
Statistics
ISBN:
9781305504912
Author:
Frederick J Gravetter, Larry B. Wallnau
Publisher:
Cengage Learning

Elementary Statistics: Picturing the World (7th E…
Statistics
ISBN:
9780134683416
Author:
Ron Larson, Betsy Farber
Publisher:
PEARSON

The Basic Practice of Statistics
Statistics
ISBN:
9781319042578
Author:
David S. Moore, William I. Notz, Michael A. Fligner
Publisher:
W. H. Freeman

Introduction to the Practice of Statistics
Statistics
ISBN:
9781319013387
Author:
David S. Moore, George P. McCabe, Bruce A. Craig
Publisher:
W. H. Freeman