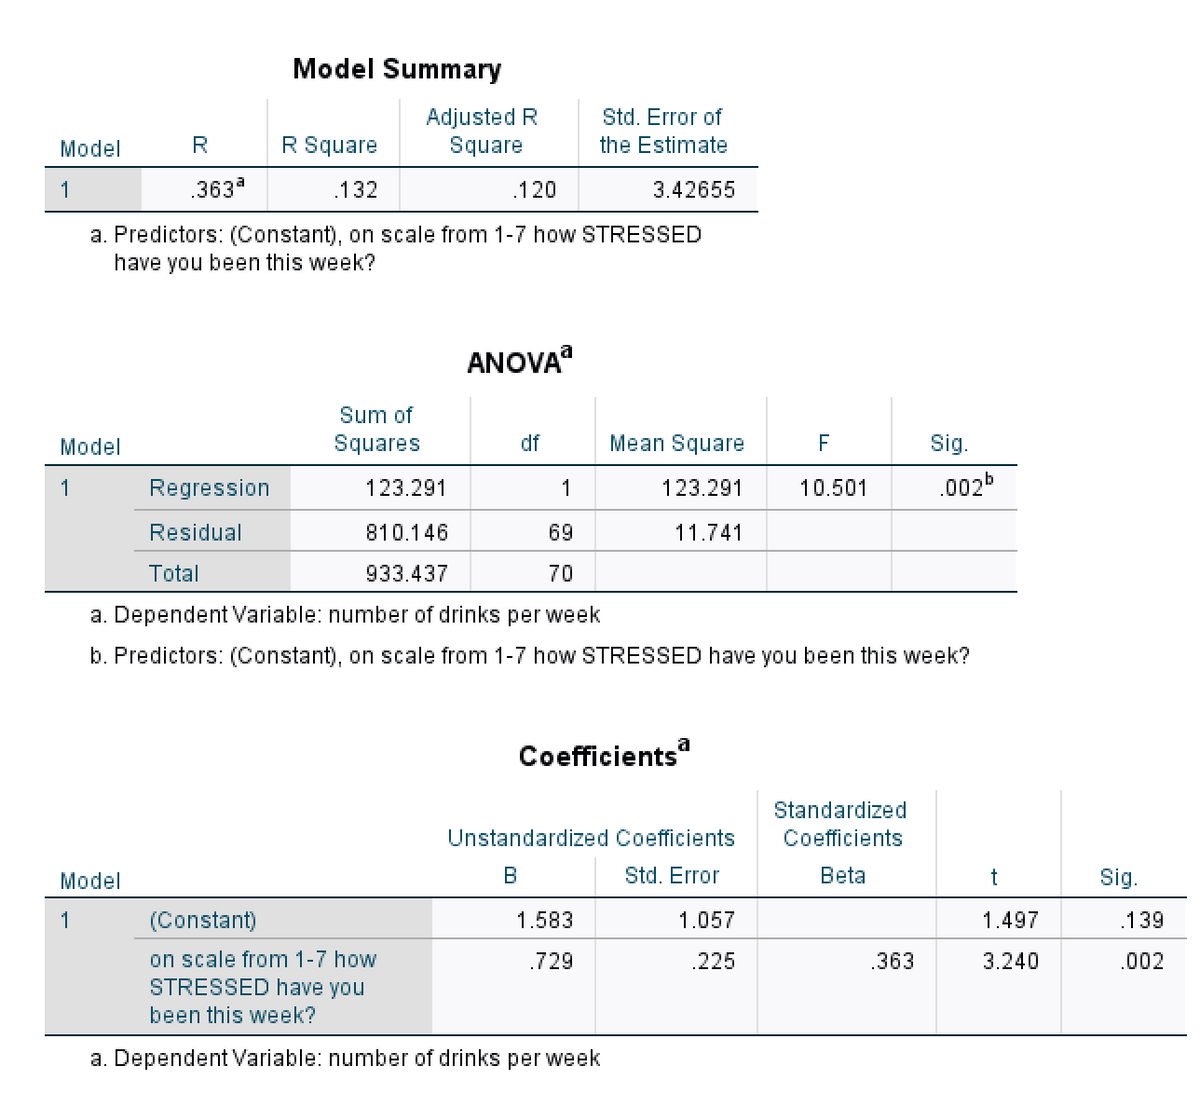
Do these results answer the question “Does stress predict d


Q: Suppose you want to evaluate the effectiveness of a job training program using twage - Bo + Bprogram…
A: Given information: The two regression equations for predicting the response variable wage are as…
Q: Define the assumptions that inferential statistics in regression are based upon?
A: Solution: Regression is a technique that is used to estimate the dependent variable by using the one…
Q: In regression with multiple input variables, which of the following can be a problem for finding…
A: Multiple regression analysis is also known as multiple linear regression (MLR) is a statistical…
Q: Briefly discuss the effect on a regression analysis of dependencies among the observations of the…
A: Dependencies among the values of the response variable:Presence of dependencies or correlations…
Q: 1. Formulate the regression equation for the data. 2. What would be the likely blood pressure…
A: The question is about regression Given :
Q: Which of the following statistical test is most appropriate to use in order to determine the…
A: In the given problem we have to answer the question of, Which of the statistical test is most…
Q: Table 3: The price of the car depreciates with its age 3 2 9. 1 4 6. 10 Age Price 2.2 2.5 3.5 1.0…
A: Hello. Since your question has multiple sub-parts, we will solve first three sub-parts for you. If…
Q: Consider a regression and correlation analysis where = 1. We know that, Multiple Choice SSE must be…
A: SSE must equal to zero, As given that r2 =1, The sum of squared error is zero for r2 = 1 because…
Q: Consider the following model without any regressors. Y; = B1 + Ui, Where the dependent variable Y;…
A: It is an important part of statistics. It is widely used.
Q: 1. What is the correlation of the correlation coefficient for the bivariate data? [Select] 2. Is…
A: The provided information is x y xy x2 y2 1.2 6.7 8.04 1.44 44.89 1.5 7.8 11.7 2.25 60.84…
Q: In a regression context, under what situation is the predicted value for Y equal to the mean of Y?
A: To find: under what situation is the predicted value for Y equal to the mean of Y Let us assume…
Q: When ratio IV and DV have a linear relationship, a __________ correlation is used. Spearman's…
A: Introduction: The suitable type of correlation is to be identified to measure the linear…
Q: A paper gives data on x- change in Body Mass Index (BMI, in kilograms/meter*) and y- change in a…
A:
Q: In a given city, age and monthly incomes are found as follows. According to these data; a) Find…
A: From the below calculation: (a) -> Beta_0 = 4414.761869 Beta_1 = 48.39795 So, Regression line…
Q: The accompanying table shows results from regressions performed on data from a random sample of 21…
A: Determine the best predicted value of the city fuel consumption. The best predicted value of the…
Q: Find the correlation coefficient and report it accurate to three decimal places.
A: Column 1 Column 2 Column 1 1 -0.63668 Column 2 -0.63668 1 correlation coefficient r =…
Q: Data was gathered from several homes for sale in Cincinnati Ohio, in order to examine the…
A: Given that When a regression equation is constructed in order to predict the price of a house based…
Q: State the regression identity for degrees of freedom in this case of three predictor variables.
A: The regression identify for degrees of freedom with k predictors and n observations and having total…
Q: Based on only the above plot, one can conclude: a) height causes an increase in weight b) weight…
A: Scatter plot: A Scatter plot is a non-mathematical representation of data, that shows the degree of…
Q: A member of COVID-19 taskforce claims that the amount of variable X, influences the decrement of…
A: Clear explanation have been provided.................
Q: A researcher was interested in investigating whether the parent-child interaction time (in hours) is…
A: Hi! Thank you for the question, As per the honor code, we are allowed to answer three sub-parts at a…
Q: In the following multiple-choice questions, select the best answer. 1. The correlation coefficient…
A: Correlation coefficient: Correlation coefficient is used to find the strength of the elation ship…
Q: The ages (X) of ten second-hand cars and their km values (Y) are given below. a) Calculate the…
A: Data given X: 3.3, 5.8,3,4.5,1.8,3.9,2 Y:35,60,21,55,34,45,2
Q: Is a linear model appropriate for the relationship between these two variables? Discuss the…
A: Let us define the independent variable , X and dependent variable , Y. X : Year (…
Q: amercial movie studios and the gross receipts for those studios. Based on the data wn in Table 4,…
A: The yearly data have been published showing the number of releases for a commercial movie studio and…
Q: Which of the following is the regression equation at the 1% meaning level according to the Minitab…
A: The coefficient that are significant at 0.01 level of significance is those coefficients with…
Q: Data were collected to explain the number of wins a major league baseball team has based on the…
A: (a) To determine the regression equation: The general form of regression equation is y^=a+bx where a…
Q: What does this data mean if the values are logistic regression analysis of presence of sarcopenia as…
A: From the given information we find the correct conclusion.
Q: Calculate and interpret the regression line for the data.
A: In this case average hours of sleep needed/night (x) is the independent variable and hours of…
Q: Looking at the following residual plot, what can you conclude
A: Residual plot analysis is critical to verification of linear regression assumption.
Q: Find the correlation coefficient and report it accurate to four decimal places. r =
A: We have to calculate the correlation coefficient between two variables x and y.
Q: 1) Write a regression model relating the mean value of y to a qualitative independent variable that…
A: We need to find the regression model relating the mean value of Y to a qualitative independent…
Q: Which of the following is a quantitative variable?
A: Quantitative variables take numerical values and represent some kind of measurements.
Q: Explain Instrumental variables regression?
A: An instrumental variable (sometimes referred to as a "instrument" variable) is a third variable, Z,…
Q: I’m interested in seeing whether or not there is a relationship between the number of hours someone…
A: As per our guidelines we can solve first three sub part of question and rest can be reposted.…
Q: The accompanying table shows results from regressions performed on data from a random sample of 21…
A: The table of regression equations given in the question is: sample size n= 21 y: response variable…
Q: Use the Table given below to find out: a. Correlation coefficient between Hydrocarbon levels and…
A:
Q: Based on the scatterplot we conclude that: there is a positive correlation r between gender and…
A: The scatterplot for men and women’s weight and the time taken to raise their pulse rate to 140 beats…
Q: The following data shows memory scores collected from adults of different ages. Age (X) Memory…
A:
Q: For the data, find the correlation and regression equation for predicting the depression from…
A: Since you have posted a question with multiple subparts, we will solve the first three complete…
Q: Listed below are annual data for various years. The data are weights (metric tons) of imported…
A: a) From the provided information, Let lemon imports = x, Crash fatality rate = y The scatterplot for…
Q: True or false? The coefficient of determination, R2. egual to the sguare of the correlation between…
A: Here as PER policy I have calculated first main question
Q: Researchers want to know if there is a relationship between social skills and intelligence. Use…
A: Hello. Since your question has multiple sub-parts, we will solve the first three sub-parts for you.…
Q: Is horsepower a Quantitative or Qualitative variable?
A: Horsepower is a unit of power which can be measured in numerical values.Therefore Horsepower is a…
Q: The full question for the last question is written down below Fail/fail to reject H0. There is…
A: The mean difference between the mean of two sample using the t test for sample size. If the sample…
Q: Which of the following best describes the difference between the interpretation of the correlation…
A: Given that, Which of the following best describes the difference between the interpretation of the…
Q: There is a dataset of size n = 51 and is for the 50 states and the District of Columbia in the…
A:
Q: Listed below are systolic blood pressure measurements ( in mm Hg ) from the same woman. Right arm…
A: Since you have asked multiple sub parts of the question, we will solve first three sub parts for…
Do these results answer the question “Does stress predict drinking behavior?”
“How strong is this relationship?”

Step by step
Solved in 2 steps

- Please do not give solution in image format thanku A local bank is using Winters' method with α = 0.2, β = 0.1, and γ = 0.5 to forecast the number of customers served each day. The bank is open Monday through Friday. At the end of the previous week, the following seasonal indexes have been estimated: Monday, 1.25; Tuesday, 0.80; Wednesday, 0.90; Thursday, 0.95; Friday, 1.10. Also, the current estimates of level and trend are 20 and 1. After observing that 30 customers are served by the bank on this Monday, forecast the number of customers who will be served on each of the next five business days. Round your answers to one decimal place, if necessary.Classify the statement below that is either descriptive statistics or statisticalinferencei. Assuming that less than 20% of the coconut plantation in the Philippines weredestroyed after a typhoon “Yolanda”, we should expect an increase of coconut oils at30% after the third month.ii. At least 10% of all floods reported in 2020 are caused by release of water from thedams during heavy rainfall.a. Descriptive statistics and Descriptive statisticsb. Descriptive statistics and Statistical inferencec. Statistical inference and Statistical inferenced. Statistical inference and Descriptive statisticsRafael Nadal, a profossional tennis player believes he can make 70% of his first serves that are at least 110 mph. His friends believe the percentage should be smaller than 70% They challenged Ralato do 400 first-serves. Rafa successfully served 255 tinesThe null hypothesis is that he can serve 70% of his first servesa) Find the observed percentage and the standard error for percentage. Round the standard error to the nearest tenth of a porcent(for example 6.3%6). Hint The SD for the box model isb) Compute the z-stalistic. Round your answer to two decimal placesc) Find te p value Round your answer to the nearest tenth of a percentifor example 6.3%)d) if the significance level is set at 5% do you reject the nulf hypothesis? What about 1%?
- Rafael Nadal, a profossional tennis player believes he can make 70% of his first serves that are at least 110 mph. His friends believe the percentage should be smaller than 70% They challenged Ralato do 400 first-serves. Rafa successfully served 255 tinesThe null hypothesis is that he can serve 70% of his first servesa) Find the observed percentage and the standard error for percentage. Round the standard error to the nearest tenth of a porcent(for example 6.3%6). Hint The SD for the box model is___b) Compute the z-stalistic. Round your answer to two decimal placesc) Find the p value Round your answer to the nearest tenth of a percent. For an example 6.3%.d) If the significance level is set at 5% do you reject the nulf hypothesis? What about at 1%?To estimate a population mean μ, the sample mean x¯ is often used as an estimator. However, a different estimator is called the sample midrange, given by the formula sample minimum + sample maximum/2. (c) The following table shows the values, in thousands of dollars, of 40 randomly selected houses in the city. (i) Calculate the sample midrange for the data. (ii) Explain why the sample midrange might be preferred to the sample mean as an estimator of the population mean.Statisticians use a measure called the ________ of the ________ ________ to find a model that approximates a set of data most accurately.
- Identify the parameter, Part II. For each of the following situations, state whether theparameter of interest is a mean or a proportion.(a) A poll shows that 64% of Americans personally worry a great deal about federal spending andthe budget deficit.(b) A survey reports that local TV news has shown a 17% increase in revenue between 2009 and2011 while newspaper revenues decreased by 6.4% during this time period.(c) In a survey, high school and college students are asked whether or not they use geolocationservices on their smart phones.(d) In a survey, smart phone users are asked whether or not they use a web-based taxi service.(e) In a survey, smart phone users are asked how many times they used a web-based taxi serviceover the last year.The Ministry of Tourism in Trinidad and Tobago is interested in developing a campaign to increase the number of visitors to the island. The Ministry in collaboration with the island’s hotels collected data to be used as a guide to determine what steps should be taken going forward. Using the data in the Microsoft Excel file attached you are required to use the knowledge you have acquired during the semester to answer the following question. Ensure that your responses are detailed and all the necessary steps are clearly outlined. Derive a model for the estimation of the probability of returning to the island from the average money spent during the visit. Discuss why regression analysis is important in decision-making.To estimate a population mean μ, the sample mean x¯ is often used as an estimator. However, a different estimator is called the sample midrange, given by the formula sample minimum + sample maximum/ 2. (a) The following table shows the values, in thousands of dollars, of 40 randomly selected houses in the city. (i) Calculate the sample midrange for the data. (ii) Explain why the sample midrange might be preferred to the sample mean as an estimator of the population mean. (b) To investigate the sampling distribution of the sample midrange, a simulation is performed in which 100 random samples of size n=40 were selected from the population of house values. For each sample, the sample midrange was calculated and recorded on the following dotplot. The mean of the distribution of sample midranges is $617,000 with standard deviation $136,000. Based on the results of the simulation, explain why the sample mean might be preferred to the sample midrange as an estimator of the population mean.
- When considering the future performance of a company, financial analysts often use forecasts for earnings per share (EPS). Naturally, we are interested in the quality of these forecasts. We can define a forecasting error as follows: Forecasting Error = Predicted Value of the Variable – The Actual Value of the Variable. The optimal forecast would have a mean forecasting error of zero. This suggests that, on average, the predicted value is equal to the actual value. Therefore, we construct a hypothesis test to see if the mean forecasting error is equal to zero. You have collected data, as shown in the picture below, for two analysts covering different industries. Analyst A covers the pharmaceutical sector; Analyst B covers the retail sector. Please complete the following tasks (1–3) and provide an answer to the following question (4): Define μ as the population mean forecasting error and formulate the null and alternative hypothesis for a zero mean test of forecasting quality. For…Describe how nonresponse might lead to bias in this survey. Does the stated margin of error account for this possible bias? People who have longer travel times to work might have less time to respond to a survey. This would cause our estimate from the sample to be greater than the true mean travel time to work. The bias due to nonresponse is not accounted for by the margin of error. People who have longer travel times to work might have less time to respond to a survey. This would cause our estimate from the sample to be less than the true mean travel time to work. The bias due to nonresponse is not accounted for by the margin of error. People who have longer travel times to work might have less time to respond to a survey. This would cause our estimate from the sample to be less than the true mean travel time to work. The bias due to nonresponse is accounted for by the margin of error. People who have longer travel times to work might have less time to respond to a survey.…Referring to the above scenario, interpret the coefficient attached to variable applications recorded: Referring to the above scenario, interpret R Square: Referring to the above scenario, interpret the F-statistic in the ANOVA analysis: Referring to above scenario, predict the amount of time it would take on average to process 150 invoices:
