
Related questions
When considering the future performance of a company, financial analysts often use forecasts for earnings per share (EPS). Naturally, we are interested in the quality of these forecasts. We can define a forecasting error as follows:
- Forecasting Error = Predicted Value of the Variable – The Actual Value of the Variable.
The optimal forecast would have a
Please complete the following tasks (1–3) and provide an answer to the following question (4):
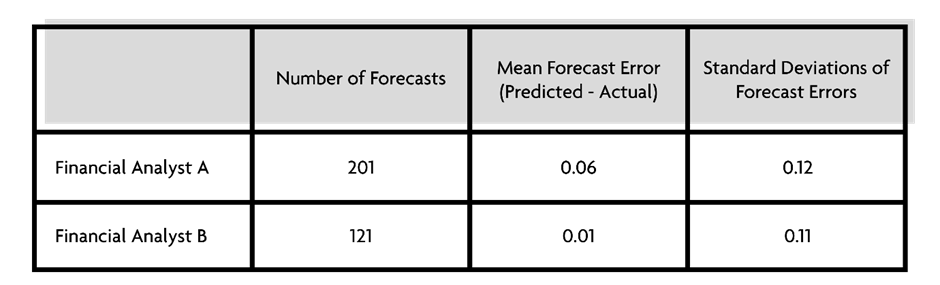
- Define μ as the population mean forecasting error and formulate the null and alternative hypothesis for a zero mean test of forecasting quality.
- For Analyst A, use both a t-test and a z-test to determine whether to reject the null hypothesis at the 0.05 and 0.01 levels of significance.
- For Analyst B, use both a t-test and a z-test to determine whether to reject the null at the 0.05 and 0.01 levels of significance.
- What conclusions do you reach about the forecasts for Analyst A and the forecasts for Analyst B?


Trending nowThis is a popular solution!

Step by stepSolved in 3 steps


- Anita Limited has shared their annual sales revenue over the last 6 financial years from 2015 to 2020. Year Sales ($ 000) 2015 4500 2016 5100 2017 4900 2018 5400 2019 5670 2020 6000 You are required to; a) Using linear trend equation forecast the sales revenue of Anita Limited for 2021. Note: See the formula sheet on the next page. P.S.: I can't attach the formula sheet in this because it has variuos symbols, such as Sigma, log, x value etc. I uploaded the formula sheet and the question as well in the chat box. Please let me know if you need any more information.arrow_forwardThe model predicts the percentage of people trusting in government' will be ___% in 2025?arrow_forwardSuppose your firm generated $50.0million$50.0million in sales. What would be the 95%95% prediction interval for your firm's net income? Write your answer using interval notation. Round your answer to 1 decimal place.arrow_forward
- If a forecaster wanted to choose a forecasting model that avoided having a large forecasting error in any given period, which error metric should they use when evaluating their forecasting options? CFE O AFE MAD MAPE O MSEarrow_forwardAs a sales analyst for the shoe retailer Foot Locker, one of your responsibilities is measuring store productivity and then reporting your conclusion back to management. Foot Locker uses sales per square foot as a measure of store productivity. While preparing your report for the second quarter results (Q2), you are able to determine that annual sales for last year ran at a rate of $406 per square foot. Therefore, $406 per square foot will be your sales estimate for the population of all Foot Locker stores during Q2. For your Q2 Sales Report, you decide to take a random sample of 64 stores. Using annual data from last year, you are able to determine that the standard deviation for sales per square foot for all 3,400 stores was $80. Therefore $80 per square foot will be your population standard deviation when compiling your Q2 report. Management has asked for the probability that your sample mean based on 64 stores is 1) within $15 and 2) within $5 of the population mean…arrow_forward1. Suppose that you estimate a model of house prices to determine the impact of having beach frontage on the value of a house.14 You do some research, and you decide to use the size of the lot instead of the size of the house for a number of theoretical and data availability rea- sons. Your results (standard errors in parentheses) are: PRICE; = 40 + 35.0 LOT¡ – 2.0 AGE; + 10.0 BED; – 4.0 FIRE; (1.0) (5.0) (10.0) (4.0) (10) N = 30 R2 =.63 where: PRICE¡ =the price of the th house (in thousands of dollars) =the size of the lot of the th house (in thousands of square feet) = the age of the th house in years =the number of bedrooms in the th house =a qualitative/dummy variable for a fireplace (1 = yes for the th house) LOT; AGE; BED; FIRE; a. You expect the variables LOT and BED to have positive coefficients. Create and test the appropriate hypotheses to evaluate these expectations at the 5-percent level. b. You expect AGE to have a negative coefficient. Create and test the appropriate…arrow_forward
- An entrepreneur who owns and operates two businesses (A and B) would like to analyze their profitability. They would like your help in the analysis. They give you the annual net profit (in thousands of $) for each business from 2008-2020. Table 1: Annual Net Profits for Businesses A and B Business Year Profit Business Year Profit 2008 -50 2008 -10 2009 57 2009 30 2010 71 2010 27 2011 64 2011 22 2012 60 2012 21 2013 50 2013 20 A 2014 41 2014 24 2015 59 2015 24 2016 71 2016 32 2017 71 2017 36 2018 74 2018 37 019 81 20 40 2020 97 2020 49 a. Suppose you want to graph the distribution of profits. Explain why using only one stem- plot might not be optimal for the analysis. b. Describe the correct stemplot to use. Generate this stemplot. Explain your steps. What can you say about the distribution from this stemplot? c. When are stemplots useful? And why is that? d. Suppose that instead of having 26 observations you have 200 observations. What graph should you generate? e. What other type of…arrow_forwardReferring to Scenario 13-11, which of the following is the correct interpretation for the slope coefficient?a) For each decrease of 1 thousand downloads, the expected revenue is estimated to increase by $3.7297 thousands.b) For each increase of 1 thousand downloads, the expected revenue is estimated to increase by $3.7297 thousands.c) For each decrease of 1 thousand dollars in expected revenue, the expected number of downloads is estimated to increase by 3.7297 thousands.d) For each increase of 1 thousand dollars in expected revenue, the expected number of downloads is estimated to increase by 3.7297 thousands.arrow_forward
- MATLAB: An Introduction with ApplicationsStatisticsISBN:9781119256830Author:Amos GilatPublisher:John Wiley & Sons Inc
 Probability and Statistics for Engineering and th...StatisticsISBN:9781305251809Author:Jay L. DevorePublisher:Cengage Learning
 Statistics for The Behavioral Sciences (MindTap C...StatisticsISBN:9781305504912Author:Frederick J Gravetter, Larry B. WallnauPublisher:Cengage Learning
  Elementary Statistics: Picturing the World (7th E...StatisticsISBN:9780134683416Author:Ron Larson, Betsy FarberPublisher:PEARSON
 The Basic Practice of StatisticsStatisticsISBN:9781319042578Author:David S. Moore, William I. Notz, Michael A. FlignerPublisher:W. H. Freeman
 Introduction to the Practice of StatisticsStatisticsISBN:9781319013387Author:David S. Moore, George P. McCabe, Bruce A. CraigPublisher:W. H. Freeman