dults with gum disease were asked the number of times per week they use Oses. The (incomplete) results are shown below: 
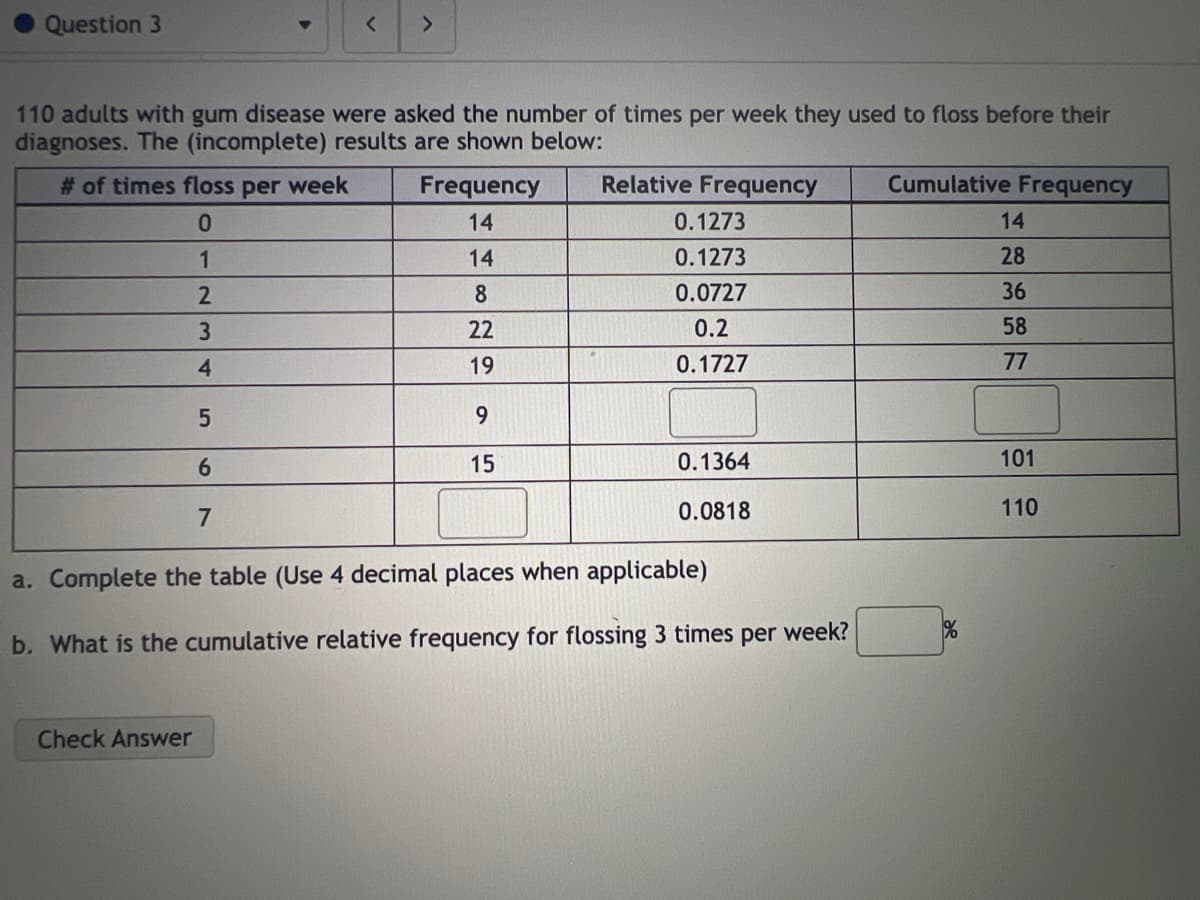
of times floss per week 0 Frequency 14 Relative Frequency 0.1273 177
Q: The amount of time a certain brand of light bulb lasts is normally distributed with a mean of 1200…
A: Let X denote the amount of time a certain brand of light bulb lasts. Given that X follows N(mean =…
Q: Please follow the steps in testing hypothesis A diet clinic states that there is an average loss of…
A: Given that Population mean=24 pound Sample size (n)=40 Sample mean = 16.3 Population standard…
Q: When Noah goes bowling, his scores are normally distributed with a mean of 135 and a standard…
A: Let X be the Noah goes bowling, his scores are normally distributed mean μ=135, standard deviations…
Q: The table below shows the inside diameter of a bored hole, on a mild steel castings from two…
A: The test statistic for test of difference of mean is given by the formula:…
Q: (i) Calculate the probability that a randomly chosen policy holder from this portfolio will make a…
A: Let us define some events A : a policy holder is from group A. B : a policy holder is from group B.…
Q: Consider the following data: x 4.493 4.130 3.132 2.702 4.660 5.572 y 1.010 2.995 4.984 6.982 9.007…
A: The objective is to determine the correlation coefficient for the given data:
Q: B. A manufacturing company is analyzing its accident record. The accidents fall into two categories:…
A: From the given information, the accident falls into two categories: Minor and majorAverage cost for…
Q: For the given dataset, find the range? 21,13,24,31,18,16,34,11
A: Given that The data set 21,13,24,31,18,16,34,11
Q: c. The test statistic z v d. The p-value = e. The p-value is ≤ v a = 2.768 X (please show your…
A: Given that n = 337 , X = 24 , p = 12% = 0.12
Q: You want to obtain a sample to estimate a population mean. Based on previous evidence, you believe…
A:
Q: Find the area of the shaded region under the standard normal distribution between the given…
A:
Q: A new assembly-line procedure to increase production has been suggested by Mr. Mump. To test whether…
A:
Q: 1.82 1.47 2.25 1.92 2.04 1.18 2.69 1.32 1.48 2.43 2.95 1.43 1.39 0.48 2.94 2.94 0.67 1.79 2.18 1.26…
A: The given data is…
Q: When Lavaughn commutes to work, the amount of time it takes him to arrive is normally distributed…
A: Given that Mean = M = 57 Standard deviation = SD = 4.5
Q: Suppose X ~ N(3, 1.2). What value of x is two standard deviations to the right of the mean?
A: from given distribution in question, mean :-μ=3 standard deviation :-σ=1.2 X is two standard…
Q: -10 9 10 11 12 13 14 15 16 17 18 19 20 21 22 23 DATA SET Y 3 4 5 6 7 8 9 10 11 12 13 14 15 16 17 18…
A: Since the observed values (in the data sets X and Y) are displayed using dots within a defined range…
Q: Test the claim that the mean GPA of night students is significantly different than 2 at the 0.2…
A:
Q: You have accepted the alternative hypothesis while the null hypothesis is true. This is Type III…
A: It is given that The null hypothesis is true and the alternative hypothesis is accepted.
Q: A polling organization reported data from a survey of 2000 randomly selected Canadians who carry…
A: From the provided information, Sample size (n) = 200 Sample mean (x̄) = 9.13 Standard deviation (s)…
Q: How do I interpret the mean 12.5 and the median 12.5 and explain how the mean and the median each…
A: Given: Mean=12.5Median=12.5
Q: The number of cans of soft drinks sold in a machine each week is recorded below. Develop forecasts…
A: Data is given for sale of each week for cans of softdrinks We have to calculate mean squared error…
Q: The number of successes and the sample size are given for a simple random sample from a population.…
A:
Q: 9 Suppose a testing service is to administer a standardized test at a given location on a certain…
A: Given that n = 60 , p = 5 / 6 , q = 1 - p = 1 - ( 5 / 6 ) = 1 / 6
Q: We wish to estimate what percent of adult residents in Ventura County like chocolate. Out of 500…
A: Given that Sample size n =500 Favorable cases x =302
Q: Find each of the following: Mean Model Class Variance
A: Given that Class Frequency (f) Mid value (x) f⋅x f⋅x2 =(f⋅x)×(x) 11-15 2 13 26 338 16-20 3…
Q: eviation of marks obtained by 40 students of a class in Statistics are 55 and 8 respectively. If…
A: Given: n(total) = 40 n(girls) = 5 n (boys) = 40-5 = 35 Mean of 40 students = 55…
Q: Consider a Markov chain with two possible states, S = {0, 1}. In particular, suppose that the…
A:
Q: A random sample of 14 items is drawn from a population whose standard deviation is unknown. The…
A: Given (a) n=14, s=5 , sample mean x̄=780 (b) n=14, s=10 , x̄=780 (c) n=14, s=20 , x̄=780
Q: What is at the "heart" of hypothesis testing in statistics? (This is a reading assessment question.…
A: Introduction: We need to identify the correct statement.
Q: Identify the lower class limits. (Type integers or decimals. Do not round. Use ascending order.)…
A: Given that Frequency distribution table Age (yr) when award was won Frequency 20-29 30…
Q: Calculate the standard error for a sample mean when the population standard deviation is 250.1 and…
A: Given Sample size = 10823 Standard deviation = 250.1
Q: (iv) f(x) 0.008+ 0.007- 0.006- 0.005- 0.004 0.003- 0.002 0.001 .0684 0 0 ← 50 100 150 200 250 300…
A: Given information: Probability mass function for the random variable x having a triangular…
Q: Given: see image Find the ff: a) GRAND MEAN b) BETWEEN and WITHIN c) TEST VALUE
A: Given: Brand A Brand B Brand C Brand D 42 28 24 20 30 36 36 32 39 31 28 38 28…
Q: 5- There is two project as follows: Probabilities The first year A B 25% 1000 500 50% 2000 1000 25%…
A: 1 year 2 year probabilities A B A B 0.25 1000 500 0 1000 0.5 2000 1000 2000 1500 0.25…
Q: What is the interquartile range of 32, 21, 17, 38 and 6.
A:
Q: A study was conducted to measure the effectiveness of hypnotism in reducing pain. The measurements…
A: The data shows the measurements in centimeters on a pain scale before and after hypnosis.
Q: Goodness-of-Fit: Conduct the specified goodness-of-fit test. Benford's Law states the probability…
A: Given that We have to conduct hypothesis testing for whether the distribution follows the…
Q: If a sign test is applied, what is the null hypothesis for a two-tailed test? Multiple Choice O Ho:…
A: Sign test is statistical test for consistent differences between pairs. Suppose, {(x1,y1), (x2,y2),…
Q: Suppose the random variable X has pdf Exp(- (u - 2)²), fx(u) = K 2√2π 0≤u≤ 4, otherwise. where K is…
A:
Q: A random selection of volunteers at a research institute has been exposed to a weak flu virus. After…
A: Given data; The population standard deviations of the distributions of recovery time (in days) for…
Q: USH Financial is a small bank that is examining its customers' use of its website. The numbers of…
A:
Q: 11% of all Americans live in poverty. If 42 Americans are randomly selected, find the probability…
A:
Q: The box-and-whisker plot shows the number of perfect scores on a mathematics standardized assessment…
A: A box plot is a great way to represents the descrete data, the midline of the Boxplot shows the…
Q: Let y be a random variable. In a population, μy=95 and o=44. Use the central limit theorem to answer…
A: Given: population mean(μy)=95population variance σy2=44Sample size (n)=107 Sample mean (y¯) =97 Y…
Q: JESTION 12 era manufacturer claims that it takes, on average, 76 minutes of continuous recording for…
A: Given that Population mean μ =76
Q: You want to obtain a sample to estimate a population proportion. Based on previous evidence, you…
A:
Q: Use the given confidence interval to find the margin of error and the sample mean. (13.3,22.9)
A:
Q: A two-proportions z-test is to be performed using the P-value approach. Use the given sample data to…
A:
Q: Identify the lower class limits, upper class limits, class width, class midpoints, and class…
A:
Step by step
Solved in 2 steps