Does the rate of violent crime acts vary across different regions of the United States? Answer this with the data in the file P10_34.xlsx as requested below. Estimate an appropriate regression model to explain the variation in violent crime rate across the four given regions of the United States. Use Region 4 as the baseline for the regression model. Round your answers to two decimal places, if necessary. If your answer is negative number, enter "minus" sign. Violent Crime Rate = + Region1 + Region2 + Region3 Interpret the estimated equation. Modify the regression model in part a to account for possible differences in the violent crime rate across the various subdivisions of the given regions. Estimate your revised regression equation. Use Subdivision 9 as the baseline for the regression model. Round your answers to two decimal places, if necessary. If your answer is negative number, enter "minus" sign. Violent Crime Rate = + Subdivision1 + Subdivision2 + Subdivision3 + Subdivision4 + Subdivision5 + Subdivision6 + Subdivision7 + Subdivision8


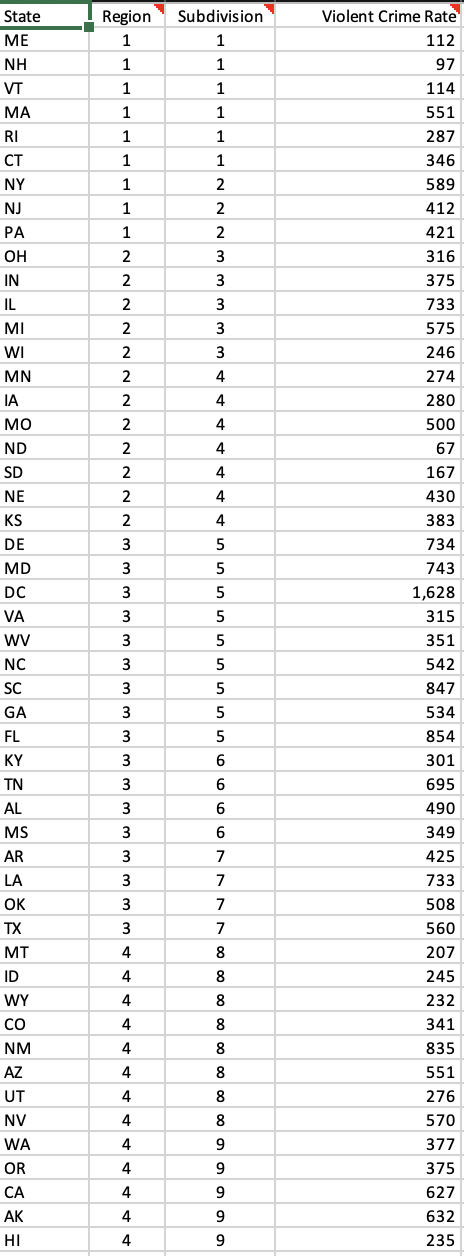
Does the rate of violent crime acts vary across different regions of the United States? Answer this with the data in the file P10_34.xlsx as requested below.
-
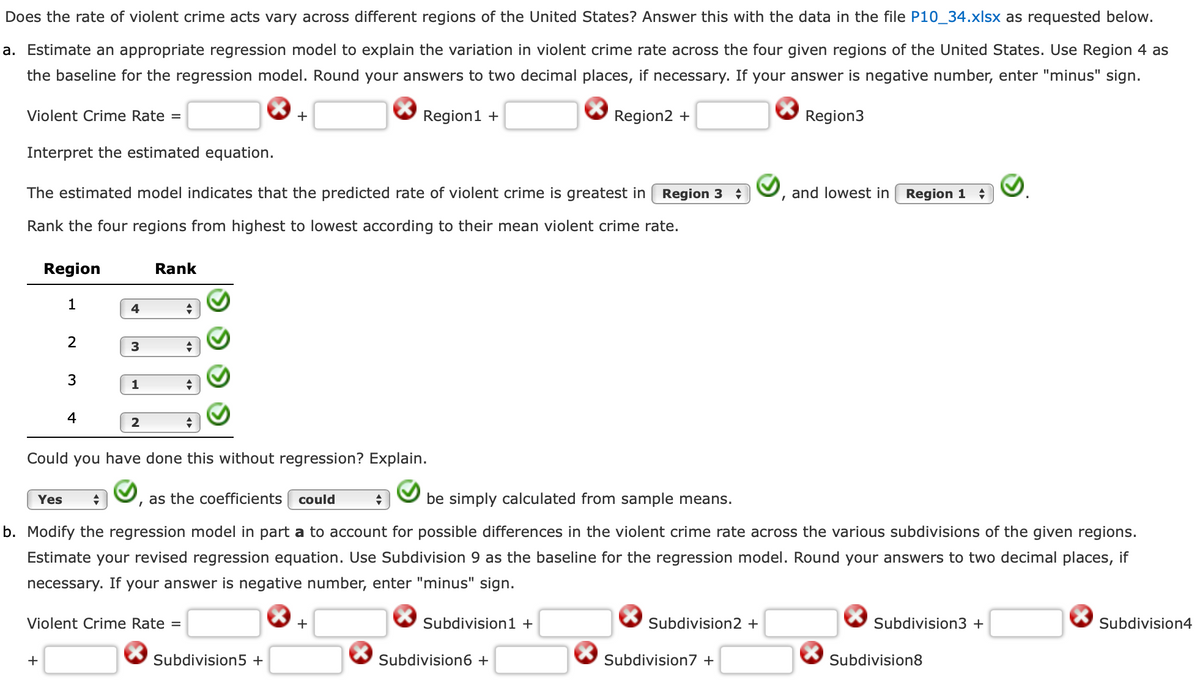
Estimate an appropriate regression model to explain the variation in violent crime rate across the four given regions of the United States. Use Region 4 as the baseline for the regression model. Round your answers to two decimal places, if necessary. If your answer is negative number, enter "minus" sign.
Violent Crime Rate = + Region1 + Region2 + Region3
Interpret the estimated equation.
-
Modify the regression model in part a to account for possible differences in the violent crime rate across the various subdivisions of the given regions. Estimate your revised regression equation. Use Subdivision 9 as the baseline for the regression model. Round your answers to two decimal places, if necessary. If your answer is negative number, enter "minus" sign.
Violent Crime Rate = + Subdivision1 + Subdivision2 + Subdivision3 + Subdivision4 + Subdivision5 + Subdivision6 + Subdivision7 + Subdivision8


Trending now
This is a popular solution!

Step by step
Solved in 6 steps with 4 images
