domly summary statistics for nfidence level. Are these results very different from the confidence interval 31.4 hg < µ< 34.8 hg with only 14 sample values, ected weights of Nborn giris: h= 246, ng, s=6.3 ng. uct a confide at is the confidence interval for the population mean u?
domly summary statistics for nfidence level. Are these results very different from the confidence interval 31.4 hg < µ< 34.8 hg with only 14 sample values, ected weights of Nborn giris: h= 246, ng, s=6.3 ng. uct a confide at is the confidence interval for the population mean u?

Glencoe Algebra 1, Student Edition, 9780079039897, 0079039898, 2018
18th Edition
ISBN:9780079039897
Author:Carter
Publisher:Carter
Chapter10: Statistics
Section10.4: Distributions Of Data
Problem 19PFA

Related questions
Question
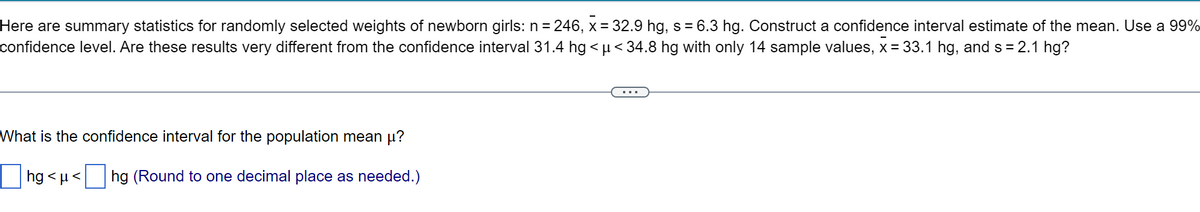
Transcribed Image Text:Here are summary statistics for randomly selected weights of newborn girls: n = 246, x = 32.9 hg, s = 6.3 hg. Construct a confidence interval estimate of the mean. Use a 99%
confidence level. Are these results very different from the confidence interval 31.4 hg < u< 34.8 hg with only 14 sample values, x = 33.1 hg, and s = 2.1 hg?
What is the confidence interval for the population mean µ?
hg <µ<
hg (Round to one decimal place as needed.)
Expert Solution
This question has been solved!
Explore an expertly crafted, step-by-step solution for a thorough understanding of key concepts.

Step by step
Solved in 2 steps

Recommended textbooks for you
Glencoe Algebra 1, Student Edition, 9780079039897…
Algebra
ISBN:
9780079039897
Author:
Carter
Publisher:
McGraw Hill
Glencoe Algebra 1, Student Edition, 9780079039897…
Algebra
ISBN:
9780079039897
Author:
Carter
Publisher:
McGraw Hill