Pain Pain D scores D2 SS variance of D=s² = df Before After 7 ED st 3 Mp = SMD n n 3 t = Mp / SMR. 4 5 26. What is the error term (sMp) for your t-test? 의244 2 3 2 1
Pain Pain D scores D2 SS variance of D=s² = df Before After 7 ED st 3 Mp = SMD n n 3 t = Mp / SMR. 4 5 26. What is the error term (sMp) for your t-test? 의244 2 3 2 1

Chapter4: Linear Functions
Section: Chapter Questions
Problem 41RE: For the following exercises, consider the data in Table 5, which shows the percent of unemployed in...

Related questions
Question
26
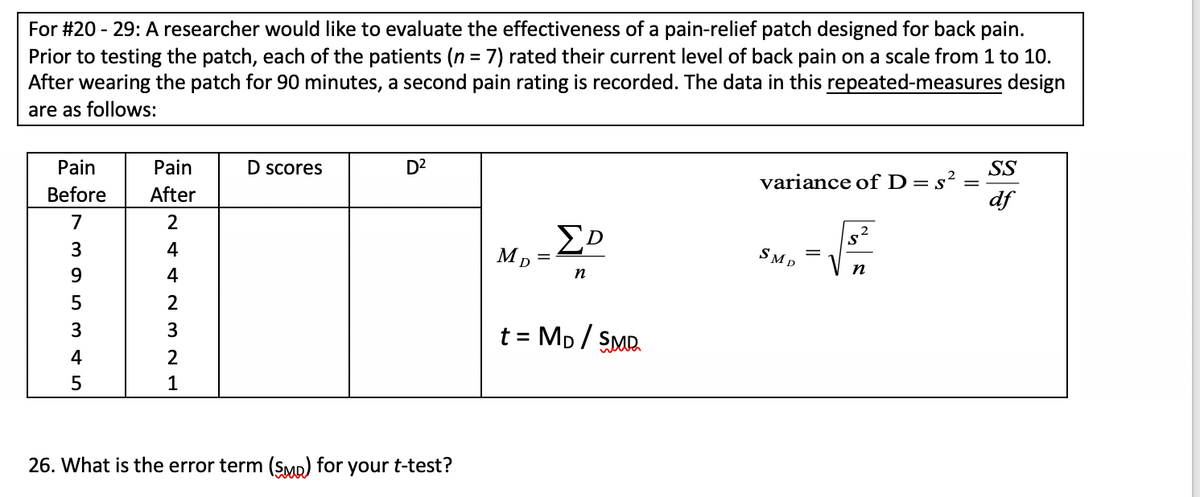
Transcribed Image Text:For #20 - 29: A researcher would like to evaluate the effectiveness of a pain-relief patch designed for back pain.
Prior to testing the patch, each of the patients (n = 7) rated their current level of back pain on a scale from 1 to 10.
After wearing the patch for 90 minutes, a second pain rating is recorded. The data in this repeated-measures design
%3D
are as follows:
Pain
Pain
D scores
D2
SS
variance of D=s²
df
Before
After
7
3
4
SMD
n
9
4
n
2
3
t = Mp / SMR.
4
1
26. What is the error term (SMp) for your t-test?
Expert Solution
This question has been solved!
Explore an expertly crafted, step-by-step solution for a thorough understanding of key concepts.

Step by step
Solved in 2 steps with 2 images

Recommended textbooks for you

Functions and Change: A Modeling Approach to Coll…
Algebra
ISBN:
9781337111348
Author:
Bruce Crauder, Benny Evans, Alan Noell
Publisher:
Cengage Learning
Functions and Change: A Modeling Approach to Coll…
Algebra
ISBN:
9781337111348
Author:
Bruce Crauder, Benny Evans, Alan Noell
Publisher:
Cengage Learning