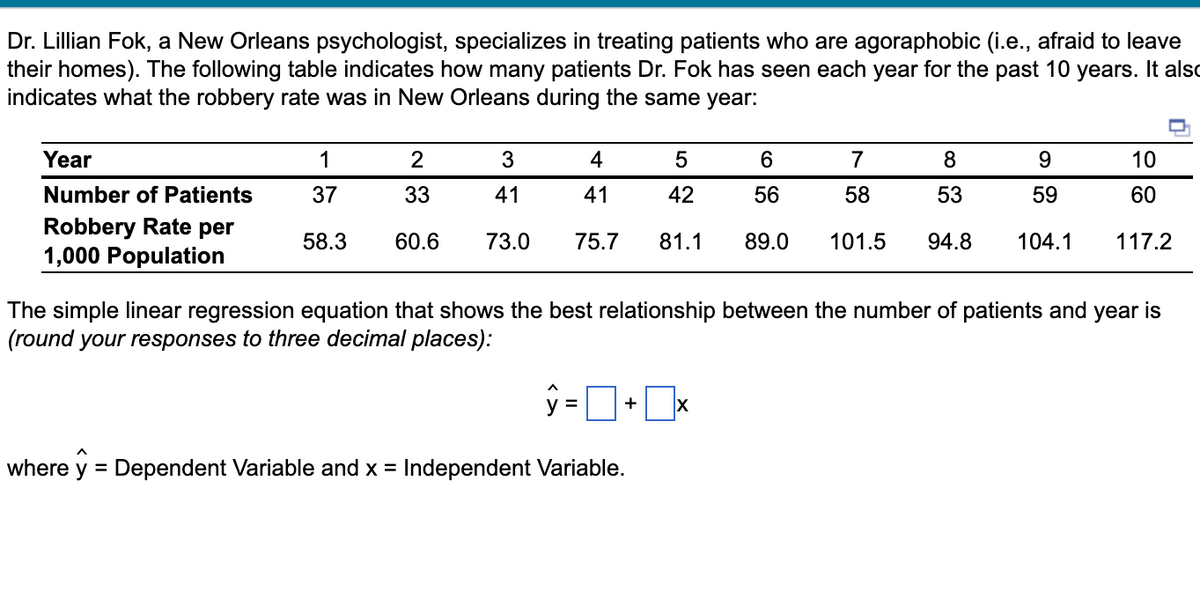
Dr. Lillian Fok, a New Orleans psychologist, specializes in treating patients who are agoraphobic (i.e., afraid to leave their homes). The following table indicates how many patients Dr. Fok has seen each year for the past 10 years. It also indicates what the robbery rate was in New Orleans during the same year: Year Number of Patients Robbery Rate per 1,000 Population 1 37 58.3 2 3 4 33 41 41 60.6 73.0 75.7 5 42 81.1 7 8 9 58 53 59 89.0 101.5 94.8 104.1 ŷ=+x where y = Dependent Variable and x = Independent Variable. 6 56 The simple linear regression equation that shows the best relationship between the number of patients and year is (round your responses to three decimal places): D 10 60 117.2


Q: Using the precedence network diagram below, create the corresponding Activity list: Start A B с E D…
A: Network diagram is a diagram that shows the visual picture of the project activities and its…
Q: Evaluate the essential components of a corporate strategy and how they are related in a project…
A: Corporate strategy is a well established long term plan which helps to describe and accomplish the…
Q: three benefits of using project management techniques in mobile app development.
A: The complexity of creating a mobile app stems from the fact that there are multiple phases involved…
Q: You have just started to work in the purchasing office of a major pharmaceutical firm. The…
A: For organizations, buyers, including purchasing agents, purchase goods and services. Buyers and…
Q: A Omani Olive oil merchant imports two Olive oil brands, A and B, from Barazil, then blends and…
A: Due to the different proportions of oils in brands G and N, the decision variables will be as…
Q: 2. A craftsman named William Barnes builds two kinds of birdhouses, one for wrens and a second…
A: Given data is House Labour Lumber Profit Wren 4 hrs 4 units $10 Bluebird 2 hrs 12 lumber $15…
Q: A catalog order-filling process can be described as follows:12 Telephone orders are taken over a…
A: Lean principles are described as the process through which transformation can be brought into the…
Q: What is the orrect graph that shows the feasible region for the problem. b. What are the extreme…
A: Linear programming is a type of mathematical optimization problem. Linear programming problems are…
Q: Café Michigan's manager, Gary Stark, suspects that demand for mocha latte coffees depends on the…
A: Linear Regression Assume X = Price Y = Number sold X Y XY X2 2.70…
Q: The 3-sigma limits for a process whose distribution conforms to the normal distribution includes…
A: Three sigma is the part of statistical. It is used for calculating the probability of the set of…
Q: explain the project management and planning software importance in the control and prevention of…
A: Project management helps in managing every project in the company. it is like a single system that…
Q: (1) SOP balances between supply and demand. True False (2) SOP process starts with running a…
A: "Since multiple questions have been asked, we will answer the first question for you. If you want…
Q: Problem 7-12 (Algo) How many work cycles should be timed to estimate the average cycle time to…
A: Given that samples are = 4.1 , 4.6 , 5.1 , 4.9 , 5.9 , 4.4 Mean of all the above samples = (4.1 +…
Q: QUESTION 12 A company has experienced the following quarterly sales for the past eight quarters…
A:
Q: esults in 100 – 99 = 1 foot of trim loss). Orders in hand for the coming week are 5,670 12-foot…
A: Given data is Pattern 12-ft 15-ft 30-ft Trim loss(ft) 1 0 6 0 10 2 0 0 3 10 3 8 0 0 4 4 2…
Q: Question Sarah and Jennifer have just graduated from college at the University of Washington in…
A: The network optimization model is a concept used in supply chain management where the executives…
Q: (1) The management of the bill of materials must be owned by the design team triggered by the…
A: 1) A bill of materials is a list of all the parts, ingredients, or materials required to assemble or…
Q: any, its suppliers, and oth
A: Supply chain management, which controls the flow of goods and services, includes all procedures used…
Q: How many pounds should be ordered at the order point? How many 10-pound b. The order is placed when…
A: In any organization, the stock of the material, products, and semi-finished products are required to…
Q: A coffee manufacturer blends four component coffee beans into three final blends of coffee. The…
A:
Q: What is the value of inventory for the Beverage Item Bar Vodka Bar Scotch Bar Gin Storage Unit Col.…
A: Ending inventory = Beginning inventory - amount issued - ending inventory Cost = Ending…
Q: I need to get the maximum value instead of the minimum value. Can you please solve the liner…
A: Linear programming is a mathematical technique that is also used in operations management…
Q: L.P. Model: Minimize Subject to: Z = 4X+3Y 1X + 2Y 240 3X+1Y275 X,Y 20 On the graph on right,…
A: An LPP problem identifying the optimal value as minimum cost or maximum profit. Here, we can…
Q: example 1a 1.plot all the corner points for the feasible area. 2. Find the optimum solution to…
A: Linear programming is a mathematical technique that is also used in operations management…
Q: Bell a consultant within the engagement team, is checking all the parameters for quality of…
A: Quality deliverables refer to the expectations of the customers for product quality. It includes…
Q: Dave Fletcher was able to determine the activity times for constructing his laser scanning machine.…
A: Activity Immediate Predecessors Duration A - 5 B - 8 C A 2 D A 1 E B 3 F B 5 G…
Q: Discuss three major benefits to the use of the contingency funds in managing projects?
A: Contingency fund is a budgeted amount which helps to meet unexpected expenses in project management.…
Q: How do hotel integrate online and social media touchpoints, customer information, and insights…
A: NOTE: We are allowed to do only one question. Hotels are now more than just a place to stay. They…
Q: Thaarugo Inc produces a GPS device that is becoming popular in parts of Scandinavia. When Thaarugo…
A: Formulae used: EOQ =2×Annual demand ×setup costHolding cost Holding cost =(H x Q) 2 Annual ordering…
Q: Mary Williams, owner of Williams Products, is evaluating whether to introduce a new product line.…
A: Given: Fixed cost = 70000 Variable cost = 8 Selling price = 22
Q: a. Determine the capacity of this process. b. Which action would yield the greatest increase…
A: Production is the process in which inputs are combined to have the required output. It includes a…
Q: Please advise whether the below topic can be use for DBA ( Doctorate of Business Administration)…
A: A Doctorate of Business Administration is a type of professional degree designed for individuals who…
Q: part b is to solve using excel solver
A: Decision Variables: Suppose-xA represents potential location A for the substationxB represents…
Q: A supplier regularly ships spare bulbs in bulk to the theater and promises a 95% reliability…
A: Sample = 20 bulbs Reliability = 95% If 2 or more bulbs go out during the test, the batch shipment is…
Q: The following data relate the sales figures of the bar in Mark Kaltenbach's small bed-and-breakfast…
A: Linear Regression Assume X = Guests Y = Bar sales X Y XY X2 16 320…
Q: What is the break-even point for option B?
A: Break-even point = fixed cost /(selling price-variable cost)
Q: A process currently services an average of 65 customers per day. Observations in recent weeks show…
A: The process of determining an organization's available production capacity and also whether it can…
Q: Each coffee table produced by Kevin Watson Designers nets the firm a profit of $10. Each bookcase…
A: Assume Decision variables: Let X1 = No of coffee tables to be produced per week and X2 = No of books…
Q: VoiceZen is one of the most trusted paint brands in the region. It has two existing manufacturing…
A:
Q: What are the three most important quality management steps in producing excellent software? (After…
A: Quality management would include determining the quality policy, implementing quality planning,…
Q: What is project risk management, and what are the necessary measures, and what are they
A: Since you have asked multiple questions, we will solve one question for you. If youwant any specific…
Q: 4.8 We Rescue, Inc., a firm providing nationwide ambulance services, intends to expand its service…
A:
Q: Describe the many ways in which project management software packages might aid in the project…
A: Definitions Project management software: - The computer-based methods or ways to manage some parts…
Q: Neptune Company has developed a small inflatable toy that it is anxious to introduce to its…
A:
Q: Short-term scheduling is important to efficiency and to cost reduction, but its impact is not of…
A: In the past, scheduling was done on a long-term basis. This meant that companies had to make…
Q: Why it is important important to understand your break even point
A: Breakeven point is a quantity of item or total dollar which facilitate the total cost equal to total…
Q: "High reliability can be achieved in a product without having high reliability in the component…
A: Total quality management is described as a system of management through which an organization can be…
Q: 20. A maximizing linear programming problem has two constraints: 2X + 4Y ≤ 100 and 3X + 10Y ≤…
A: Given data is Constraint 1 = 2X+4Y≤100 Constraint 2 = 3X+10Y≤210
Q: Minimize Z = 3x₁ + 2x₂ + 7x3, subject to -x₁ + x₂ = 10 2x₁ - x₂ + x3 ≥ 10 x2 and X₁ ≥ 0, X₂ ≥ 0, x3…
A: Linear programming is a mathematical technique that is also used in operations management…
Q: A foundry has a fixed daily cost of Rs. 50,000 whenever it operates and a variable cost of Rs. 800…
A: Given data is Fixed cost = Rs. 50,000 Variable cost = Rs. 800Q Daily production = 100 tonnes


Trending now
This is a popular solution!

Step by step
Solved in 3 steps with 2 images

- The eTech Company is a fairly recent entry in the electronic device area. The company competes with Apple. Samsung, and other well-known companies in the manufacturing and sales of personal handheld devices. Although eTech recognizes that it is a niche player and will likely remain so in the foreseeable future, it is trying to increase its current small market share in this huge competitive market. Jim Simons, VP of Production, and Catherine Dolans, VP of Marketing, have been discussing the possible addition of a new product to the companys current (rather limited) product line. The tentative name for this new product is ePlayerX. Jim and Catherine agree that the ePlayerX, which will feature a sleeker design and more memory, is necessary to compete successfully with the big boys, but they are also worried that the ePlayerX could cannibalize sales of their existing productsand that it could even detract from their bottom line. They must eventually decide how much to spend to develop and manufacture the ePlayerX and how aggressively to market it. Depending on these decisions, they must forecast demand for the ePlayerX, as well as sales for their existing products. They also realize that Apple. Samsung, and the other big players are not standing still. These competitors could introduce their own new products, which could have very negative effects on demand for the ePlayerX. The expected timeline for the ePlayerX is that development will take no more than a year to complete and that the product will be introduced in the market a year from now. Jim and Catherine are aware that there are lots of decisions to make and lots of uncertainties involved, but they need to start somewhere. To this end. Jim and Catherine have decided to base their decisions on a planning horizon of four years, including the development year. They realize that the personal handheld device market is very fluid, with updates to existing products occurring almost continuously. However, they believe they can include such considerations into their cost, revenue, and demand estimates, and that a four-year planning horizon makes sense. In addition, they have identified the following problem parameters. (In this first pass, all distinctions are binary: low-end or high-end, small-effect or large-effect, and so on.) In the absence of cannibalization, the sales of existing eTech products are expected to produce year I net revenues of 10 million, and the forecast of the annual increase in net revenues is 2%. The ePIayerX will be developed as either a low-end or a high-end product, with corresponding fixed development costs (1.5 million or 2.5 million), variable manufacturing costs ( 100 or 200). and selling prices (150 or 300). The fixed development cost is incurred now, at the beginning of year I, and the variable cost and selling price are assumed to remain constant throughout the planning horizon. The new product will be marketed either mildly aggressively or very aggressively, with corresponding costs. The costs of a mildly aggressive marketing campaign are 1.5 million in year 1 and 0.5 million annually in years 2 to 4. For a very aggressive campaign, these costs increase to 3.5 million and 1.5 million, respectively. (These marketing costs are not part of the variable cost mentioned in the previous bullet; they are separate.) Depending on whether the ePlayerX is a low-end or high-end produce the level of the ePlayerXs cannibalization rate of existing eTech products will be either low (10%) or high (20%). Each cannibalization rate affects only sales of existing products in years 2 to 4, not year I sales. For example, if the cannibalization rate is 10%, then sales of existing products in each of years 2 to 4 will be 10% below their projected values without cannibalization. A base case forecast of demand for the ePlayerX is that in its first year on the market, year 2, demand will be for 100,000 units, and then demand will increase by 5% annually in years 3 and 4. This base forecast is based on a low-end version of the ePlayerX and mildly aggressive marketing. It will be adjusted for a high-end will product, aggressive marketing, and competitor behavior. The adjustments with no competing product appear in Table 2.3. The adjustments with a competing product appear in Table 2.4. Each adjustment is to demand for the ePlayerX in each of years 2 to 4. For example, if the adjustment is 10%, then demand in each of years 2 to 4 will be 10% lower than it would have been in the base case. Demand and units sold are the samethat is, eTech will produce exactly what its customers demand so that no inventory or backorders will occur. Table 2.3 Demand Adjustments When No Competing Product Is Introduced Table 2.4 Demand Adjustments When a Competing Product Is Introduced Because Jim and Catherine are approaching the day when they will be sharing their plans with other company executives, they have asked you to prepare an Excel spreadsheet model that will answer the many what-if questions they expect to be asked. Specifically, they have asked you to do the following: You should enter all of the given data in an inputs section with clear labeling and appropriate number formatting. If you believe that any explanations are required, you can enter them in text boxes or cell comments. In this section and in the rest of the model, all monetary values (other than the variable cost and the selling price) should be expressed in millions of dollars, and all demands for the ePlayerX should be expressed in thousands of units. You should have a scenario section that contains a 0/1 variable for each of the binary options discussed here. For example, one of these should be 0 if the low-end product is chosen and it should be 1 if the high-end product is chosen. You should have a parameters section that contains the values of the various parameters listed in the case, depending on the values of the 0/1 variables in the previous bullet For example, the fixed development cost will be 1.5 million or 2.5 million depending on whether the 0/1 variable in the previous bullet is 0 or 1, and this can be calculated with a simple IF formula. You can decide how to implement the IF logic for the various parameters. You should have a cash flows section that calculates the annual cash flows for the four-year period. These cash flows include the net revenues from existing products, the marketing costs for ePlayerX, and the net revenues for sales of ePlayerX (To calculate these latter values, it will help to have a row for annual units sold of ePlayerX.) The cash flows should also include depreciation on the fixed development cost, calculated on a straight-line four-year basis (that is. 25% of the cost in each of the four years). Then, these annual revenues/costs should be summed for each year to get net cash flow before taxes, taxes should be calculated using a 32% tax rate, and taxes should be subtracted and depreciation should be added back in to get net cash flows after taxes. (The point is that depreciation is first subtracted, because it is not taxed, but then it is added back in after taxes have been calculated.) You should calculate the company's NPV for the four-year horizon using a discount rate of 10%. You can assume that the fixed development cost is incurred now. so that it is not discounted, and that all other costs and revenues are incurred at the ends of the respective years. You should accompany all of this with a line chart with three series: annual net revenues from existing products; annual marketing costs for ePlayerX; and annual net revenues from sales of ePlayerX. Once all of this is completed. Jim and Catherine will have a powerful tool for presentation purposes. By adjusting the 0/1 scenario variables, their audience will be able to see immediately, both numerically and graphically, the financial consequences of various scenarios.This problem is based on Motorolas online method for choosing suppliers. Suppose Motorola solicits bids from five suppliers for eight products. The list price for each product and the quantity of each product that Motorola needs to purchase during the next year are listed in the file P06_93.xlsx. Each supplier has submitted the percentage discount it will offer on each product. These percentages are also listed in the file. For example, supplier 1 offers a 7% discount on product 1 and a 30% discount on product 2. The following considerations also apply: There is an administrative cost of 5000 associated with setting up a suppliers account. For example, if Motorola uses three suppliers, it incurs an administrative cost of 15,000. To ensure reliability, no supplier can supply more than 80% of Motorolas demand for any product. A supplier must supply an integer amount of each product it supplies. Develop a linear integer model to help Motorola minimize the sum of its purchase and administrative costs.You want to take out a 450,000 loan on a 20-year mortgage with end-of-month payments. The annual rate of interest is 3%. Twenty years from now, you will need to make a 50,000 ending balloon payment. Because you expect your income to increase, you want to structure the loan so at the beginning of each year, your monthly payments increase by 2%. a. Determine the amount of each years monthly payment. You should use a lookup table to look up each years monthly payment and to look up the year based on the month (e.g., month 13 is year 2, etc.). b. Suppose payment each month is to be the same, and there is no balloon payment. Show that the monthly payment you can calculate from your spreadsheet matches the value given by the Excel PMT function PMT(0.03/12,240, 450000,0,0).
- The new Chief Operating Officer (COO) of Lee Ching Chemical Company, MaxChing, has found that the firm has been dumping its toxic waste into the local riverfor the last four years and falsifying information to officials about the amounts ofalleged cancer-causing materials in the waste. The plant overseer claims there is noevidence that the waste will cause cancer. Besides, within a hundred kilometersdownriver, there are only a few fishing villages. If the company had to treat thesubstance to neutralize its potentially harmful effects and transport it to a legaldumpsite, the operating costs of the company would rise to a level that could renderthe company uncompetitive. When the organization loses its competitive advantage,five thousand local workers can become unemployed and the economy of that towncould collapse. Question: If you were the COO, what would you do? Why?A rice importer has three sources: Thailand, Vietnam, and China. Unfortunately, the annual amount of rice harvested is heavily dependent upon the amount of rainfall during the growing season. The tables below show probabilities and prices for wet, dry, and normal growing seasons. Rice is sold in tons. PROBABILITIES Wet Dry Normal Thailand 0.5 0.2 0.3 Vietnam 0.6 0.3 0.1 China 0.4 0.4 0.2 Price per Pound ($) Wet Dry Normal Thailand 0.95 1.10 1.00 Vietnam 0.85 1.20 0.98 China 0.90 1.15 1.05 This is a maximization problem. True or False?A rice importer has three sources: Thailand, Vietnam, and China. Unfortunately, the annual amount of rice harvested is heavily dependent upon the amount of rainfall during the growing season. The tables below show probabilities and prices for wet, dry, and normal growing seasons. Rice is sold in tons. PROBABILITIES Wet Dry Normal Thailand 0.5 0.2 0.3 Vietnam 0.6 0.3 0.1 China 0.4 0.4 0.2 Price per Pound ($) Wet Dry Normal Thailand 0.95 1.10 1.00 Vietnam 0.85 1.20 0.98 China 0.90 1.15 1.05 This is a maximization problem. A)True B)False
- A motion picture industry analyst is studying movies based on epic novels. The following data were obtained for 10 Hollywood movies made in the past five years. Each movie was based on an epic novel. For these data, x1 = first-year box office receipts of the movie, x2 = total production costs of the movie, x3 = total promotional costs of the movie, and x4 = total book sales prior to movie release. All units are in millions of dollars. x1 x2 x3 x4 85.1 8.5 5.1 4.7 106.3 12.9 5.8 8.8 50.2 5.2 2.1 15.1 130.6 10.7 8.4 12.2 54.8 3.1 2.9 10.6 30.3 3.5 1.2 3.5 79.4 9.2 3.7 9.7 91.0 9.0 7.6 5.9 135.4 15.1 7.7 20.8 89.3 10.2 4.5 7.9 a) Suppose Hollywood is planning a new epic movie with projected box office sales x1 = 100 million and production costs x2 = 12 million. The book on which the movie is based had sales of x4 = 9.2 million. Forecast the dollar amount (in millions) that should be budgeted for promotion costs x3 and find an 80% confidence interval for your…An investment advisor at RMC Financial Services wants to develop a model that can be used to allocate investment funds among four alternatives: stocks, bonds, mutual funds, and cash. For the coming investment period, the company developed estimates of the annual rate of return and the associated risk for each alternative. Risk is measured between 0 and 1, with higher risk value denoting more volatility and thus more uncertainty. The estimated rate of return for stocks is 10%, for bonds 3%, for mutual funds 4%, and cash 1%. The risk index for the stocks, bonds, and mutual funds investment is estimated as 0.8, 0.2, and 0.3, respectively. Because cash is held in money market funds, the annual return is lower, but it carries essentially no risk (i.e., risk index is zero for cash investment). The objective is to determine the portion of funds allocated to each investment alternatives in order to maximize the total annual return for the portfolio subject to the risk level the client is…Kidnly answer the following and include steps: Financial planner Minnie Margin has a substantial number of clients who wish to own a mutual fund portfolio that matches, as a whole, the performance of the Russell 2000 index. Her task is to determine what proportion of the portfolio should be invested in each of the five mutual funds listed below so that the portfolio most closely mimics the performance of the Russell 2000 index. Annual Returns Year 1 Year 2 Year 3 Year 4 International Stock 22.37 26.73 4.86 2.17 Large-Cap Value 15.48 19.64 11.50 -5.25 Mid-Cap Value 17.42 20.07 -4.97 -1.69 Small-Cap Growth 23.18 12.36 3.25 3.81 Short-Term Bond 9.26 8.81 6.15 4.04 Russell 2000 Index 20 22 8 2 a. Write out the (non-linear) program that would produce a portfolio that most closely mimics the performance of the Russell 2000 Index. b. Use Excel's Solver with "GRG Non-Linear" as the solution algorithm:…
- An investment advisor at Shore Financial Services wants to develop a model that can be used to allocate investment funds among four alternatives: stocks, bonds, mutual funds, and cash. For the coming investment period, the company developed estimates of the annual rate of return and the associated risk for each alternative. Risk is measured using an index between 0 and 1, with higher risk values denoting more volatility and thus more uncertainty. Investment Annual Rate of Return (%) Risk Stocks. 10 0.8 Bonds 3 0.2 Mutual funds 4 0.3 Cash 1 0.0 Because cash is held in a money market fund, the annual…A rice importer has three sources: Thailand, Vietnam, and China. Unfortunately, the annual amount of rice harvested is heavily dependent upon the amount of rainfall during the growing season. The tables below show probabilities and prices for wet, dry, and normal growing seasons. Rice is sold in tons. PROBABILITIES Wet Dry Normal Thailand 0.5 0.2 0.3 Vietnam 0.6 0.3 0.1 China 0.4 0.4 0.2 Price per Pound ($) Wet Wet Dry Normal Thailand 0.95 1.10 1.00 Vietnam 0.85 1.20 0.98 China 0.90 1.15 1.05 This is a maximization problem. A)True B)Flase