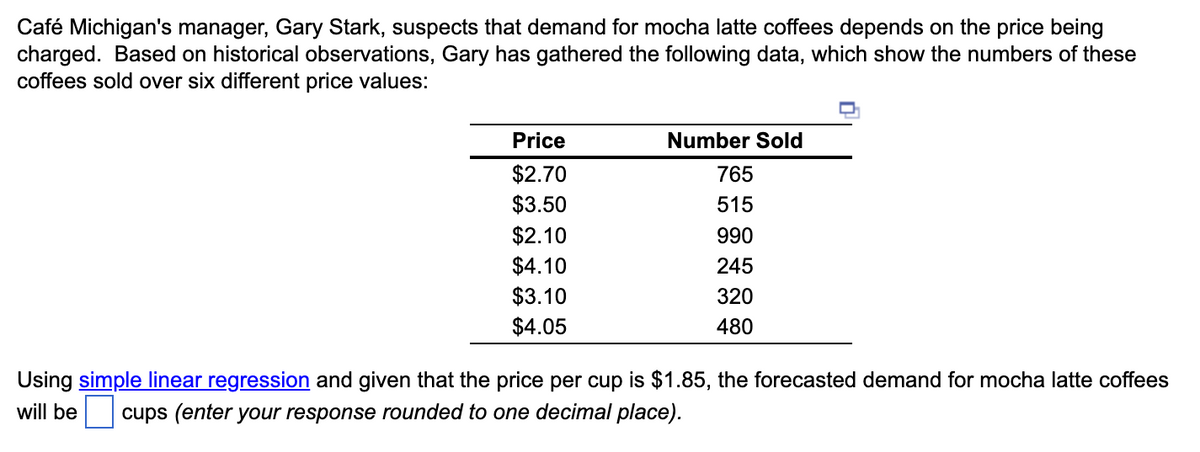
Café Michigan's manager, Gary Stark, suspects that demand for mocha latte coffees depends on the price being charged. Based on historical observations, Gary has gathered the following data, which show the numbers of these coffees sold over six different price values: Price $2.70 $3.50 $2.10 $4.10 $3.10 $4.05 Number Sold 765 515 990 245 320 480 Using simple linear regression and given that the price per cup is $1.85, the forecasted demand for mocha latte coffees will be cups (enter your response rounded to one decimal place).


Q: Barksdale Biscuits is a small manufacturer of gourmet dog biscuits and uses an average of 6,400…
A: Given, Weekly demand = 6400 pounds / week Number of weeks / year = 50 Annual Demand D = 6400*50 =…
Q: A retired couple supplement their income by making fruit pies, which they sell to a local grocery…
A: Decision Variables: Suppose-A be the no. of apple pies producedG be the no. of grape pies produced…
Q: Mr. Stone has recently installed a vending machine outside a local supermarket to sell a new brand…
A: Replenishment rule = every P time period, order T-IP units. T (Target inventory level) = Average…
Q: Solve the transport problem by using the method of the potentials if the following initial…
A: Find the given details below: Transportation table Suppliers Consumers b1 b2 b3 b4 Supply…
Q: 4. Quarterly demand for smartphones at a retailer is as shown. After obtaining initial estimates for…
A:
Q: The Sellinger Business School's Information Technology Service (ITS) is considering a new process to…
A: Work in process inventory can be identified by calculating the difference between maximum capacity…
Q: Use the trend projection method, and the trend projection with seasonal adjustment method to create…
A: Find the given details below: Given details: Period Year Month #Passengers 1 2010 January 151…
Q: A catalog order-filling process can be described as follows:12 Telephone orders are taken over a…
A: Lean principles are described as the process through which transformation can be brought into the…
Q: Klein Chemicals, Inc., produces a special oil-based material that is currently in short supply. Four…
A: Given data is
Q: Which of the following is a process consideration in the implementation of a lean system?…
A: A company or business unit is said to have a lean system if it applies lean concepts to all aspects…
Q: Consider the following LP problem developed at Zafar Malik's Carbondale, Illinois, optical scanning…
A: Linear programming problem helps to identify the optimal point as maximum profit or minimum costs by…
Q: Calculate the reorder level b) Calculate the maximum level of inventory c) Calculate the minimum…
A: Given: Average usage 800 minimum usage 540 maximum usage 1260 minimum lead time 16…
Q: Maryland transportation authority decided to setup toll booths on either side of the Fort McHenry…
A: Given data: Total number of vehicles (n) = 3900/hr Time spend at 1 tollbooth (t) = 2min/vehicle
Q: Consider the following LP. (a) Put the problem into standard form, using slack, excess, and…
A: As per Bartleby guidelines, we can only solve the first three subparts of one question at a…
Q: Can you please solve the linear function with clear steps. it is better to be graphically instead of…
A: First let us define the variables x1 as the stocks and x2 as bonds. Now since the objective is to…
Q: Solve the following linear programming problem graphically: Maximize Z=3X+5Y Subject to: 4X+4Y≤48 C₁…
A: When using a graphical technique, the viable zone is used to discover the solution to problems based…
Q: How does MRP system information processing function?
A: MRP stands for Material requirements planning. It is a software-based system to manage the inventory…
Q: a. A loan processing operation that processes an average of 7 loans per day. The operation has a…
A: Production is the process in which inputs are combined to have the required output. It includes a…
Q: Analyse the eight elements of total quality management and determine which you believe are present…
A: 8 elements of total Quality management: Total quality management is a management…
Q: Manager at FreeAir Lid, a leading manufacturer of fans used in air conditioning systems. The company…
A: The Breakeven Point is that level of sales at which there is no profit no loss. In other words at…
Q: What is the break-even point for option B?
A: Break-even point = fixed cost /(selling price-variable cost)
Q: An operations manager is deciding on the level of automation for a new process. The fixed cost for…
A: Formula to be used : Break even point = Fixed cost / Contribution margin per unit
Q: Many of a bank’s customers use its automatic teller machine to transact business after normal…
A: Given- Arrival rate (λ) = 1 customer every 2 minutes =30 customer per hourService rate (μ) =…
Q: Model the following fragment of a business process: Process 1: Once a loan application has been…
A: In order to model the given business process, a flow chart can be prepared. In a flow chart, various…
Q: Given the following data on the number of complaints from customers in the past few weeks. Week…
A: Linear trend line is of the form: Y= a+bx where a is the intercept, b is the slope, x is the…
Q: Based on your understanding of the case study and further readings, do you think Tiger Brands made…
A: SCM is a strategic approach to integrating supply and demand in the market. It involves several…
Q: Purple Swift manufactures birdhouses in lots of 10. Each birdhouse takes 30 minutes to paint. After…
A: Batch size of birdhouses = B = 10 Time to paint a birdhouse = Tr = 30 minutes Time required for…
Q: Each day, a FedEx competitor processes approximately 50,000 shipments. Suppose that they use the…
A:
Q: Determine: a) The cycle time in minutes; b) the minimum number of workstations for this contract; c)…
A: Project schedule helps in calculating different values all related to the production cycle like the…
Q: ming,norming ect)
A: Team development stages according to Tuckman Bruce Wayne Tuckman first created and published the…
Q: 1. a. name and discuss 3 ways MRP and Kanban are different b. explain how the Kanban process…
A: The MRP & Kanban both have shown similar objectives - to save cost by keeping minimum levels of…
Q: Mariah Enterprises make product A, which sells for $130 per unit, and product B, which sells for…
A: Multifactor productivity is output per unit of combined input unit. In Input include labor,…
Q: d) Hurwicz (alpha = 0.30) e) Equal Likelihood f) What coefficient of pessimism should a farmer…
A: Formulae used: (i) Hurwicz = α x (Maximum Payoff for Alternatives) + (1 - α) x (Minimum Payoff for…
Q: What are the three most important quality management steps in producing excellent software
A: Management of service quality lies at the heart of what is meant by the phrase quality management.…
Q: What are The four main stages in the topic coherence framework pipeline depicted?
A: Ans) Coherence framework pipeline is very important. It becomes a essential part of the process.…
Q: .What is the objective function? 2. Express the first constraint (wood) in mathematical sentence 3.…
A: Linear programming is a mathematical technique that is also used in operations management…
Q: What terms would you use to characterize the various steps in the design and analysis process?
A: Design and analysis are two stages of a process that play a role in process or product success or…
Q: Luminia Inc. has about five absences per 100 employees each day. Every day, it loses about 13% of…
A: Ans) Number of absence per 100 employees is called incidence rate. Incidence rate = 5% The…
Q: What is the most important difference between the agile project management methodology and the…
A: Project management is the process of planning and organizing the resources of the company. These are…
Q: How does risk management operate and what is it? What exactly about risk and asset vulnerability…
A: Risk management can be broadly defined as the process of identification, evaluation, prevention and…
Q: please write a clear answer for each part of the question
A: Decision Variable: Suppose-xij represents the units shipped from node i to node j
Q: Thaarugo Inc produces a GPS device that is becoming popular in parts of Scandinavia. When Thaarugo…
A: Formulae used: EOQ =2×Annual demand ×setup costHolding cost Holding cost =(H x Q) 2 Annual ordering…
Q: What are the three most important quality management steps in producing excellent software? (After…
A: Quality management would include determining the quality policy, implementing quality planning,…
Q: he Apex Television Company has to decide on the number of 27- and 20-inch sets to be produced at one…
A:
Q: A mechanic at the Department of Maintenance makes minor repairs to faulty golf electric carts. The…
A: From the above given information, Arrival rate, λ =4 carts per day (1 day= 8 hour shift)…
Q: What is the break-even quantity?
A: Production is the process in which inputs are combined to have the required output. It includes a…
Q: What are some potential weaknesses of stakeholder theory? Can they be remedied?
A: The stakeholder theory discusses ethics and values in organisational management. R. Strategic…
Q: The Sellinger Business School's Information Technology Service (ITS) is considering a new process to…
A: Capacity indicating the proportion between total available time and unit processing time. Bottleneck…
Q: he number of plumbing repair jobs performed by Augur’s Plumbing Service during each month last year.…
A:
Q: How does a systems selection report function and what is it?
A: A system selection report is a graphical visualization that helps the organization choose the best…


Trending now
This is a popular solution!

Step by step
Solved in 2 steps with 2 images

- The owner of a restaurant in Bloomington, Indiana, has recorded sales data for the past 19 years. He has also recorded data on potentially relevant variables. The data are listed in the file P13_17.xlsx. a. Estimate a simple regression equation involving annual sales (the dependent variable) and the size of the population residing within 10 miles of the restaurant (the explanatory variable). Interpret R-square for this regression. b. Add another explanatory variableannual advertising expendituresto the regression equation in part a. Estimate and interpret this expanded equation. How does the R-square value for this multiple regression equation compare to that of the simple regression equation estimated in part a? Explain any difference between the two R-square values. How can you use the adjusted R-squares for a comparison of the two equations? c. Add one more explanatory variable to the multiple regression equation estimated in part b. In particular, estimate and interpret the coefficients of a multiple regression equation that includes the previous years advertising expenditure. How does the inclusion of this third explanatory variable affect the R-square, compared to the corresponding values for the equation of part b? Explain any changes in this value. What does the adjusted R-square for the new equation tell you?The Baker Company wants to develop a budget to predict how overhead costs vary with activity levels. Management is trying to decide whether direct labor hours (DLH) or units produced is the better measure of activity for the firm. Monthly data for the preceding 24 months appear in the file P13_40.xlsx. Use regression analysis to determine which measure, DLH or Units (or both), should be used for the budget. How would the regression equation be used to obtain the budget for the firms overhead costs?Suppose that a regional express delivery service company wants to estimate the cost of shipping a package (Y) as a function of cargo type, where cargo type includes the following possibilities: fragile, semifragile, and durable. Costs for 15 randomly chosen packages of approximately the same weight and same distance shipped, but of different cargo types, are provided in the file P13_16.xlsx. a. Estimate a regression equation using the given sample data, and interpret the estimated regression coefficients. b. According to the estimated regression equation, which cargo type is the most costly to ship? Which cargo type is the least costly to ship? c. How well does the estimated equation fit the given sample data? How might the fit be improved? d. Given the estimated regression equation, predict the cost of shipping a package with semifragile cargo.
- Do the sales prices of houses in a given community vary systematically with their sizes (as measured in square feet)? Answer this question by estimating a simple regression equation where the sales price of the house is the dependent variable, and the size of the house is the explanatory variable. Use the sample data given in P13_06.xlsx. Interpret your estimated equation, the associated R-square value, and the associated standard error of estimate.The management of a technology company is trying to determine the variable that best explains the variation of employee salaries using a sample of 52 full-time employees; see the file P13_08.xlsx. Estimate simple linear regression equations to identify which of the following has the strongest linear relationship with annual salary: the employees gender, age, number of years of relevant work experience prior to employment at the company, number of years of employment at the company, or number of years of post secondary education. Provide support for your conclusion.The file P13_22.xlsx contains total monthly U.S. retail sales data. While holding out the final six months of observations for validation purposes, use the method of moving averages with a carefully chosen span to forecast U.S. retail sales in the next year. Comment on the performance of your model. What makes this time series more challenging to forecast?
- Stock market analysts are continually looking for reliable predictors of stock prices. Consider the problem of modeling the price per share of electric utility stocks (Y). Two variables thought to influence this stock price are return on average equity (X1) and annual dividend rate (X2). The stock price, returns on equity, and dividend rates on a randomly selected day for 16 electric utility stocks are provided in the file P13_15.xlsx. Estimate a multiple regression equation using the given data. Interpret each of the estimated regression coefficients. Also, interpret the standard error of estimate and the R-square value for these data.The file P13_02.xlsx contains five years of monthly data on sales (number of units sold) for a particular company. The company suspects that except for random noise, its sales are growing by a constant percentage each month and will continue to do so for at least the near future. a. Explain briefly whether the plot of the series visually supports the companys suspicion. b. By what percentage are sales increasing each month? c. What is the MAPE for the forecast model in part b? In words, what does it measure? Considering its magnitude, does the model seem to be doing a good job? d. In words, how does the model make forecasts for future months? Specifically, given the forecast value for the last month in the data set, what simple arithmetic could you use to obtain forecasts for the next few months?The file P13_42.xlsx contains monthly data on consumer revolving credit (in millions of dollars) through credit unions. a. Use these data to forecast consumer revolving credit through credit unions for the next 12 months. Do it in two ways. First, fit an exponential trend to the series. Second, use Holts method with optimized smoothing constants. b. Which of these two methods appears to provide the best forecasts? Answer by comparing their MAPE values.
- At the beginning of each week, a machine is in one of four conditions: 1 = excellent; 2 = good; 3 = average; 4 = bad. The weekly revenue earned by a machine in state 1, 2, 3, or 4 is 100, 90, 50, or 10, respectively. After observing the condition of the machine at the beginning of the week, the company has the option, for a cost of 200, of instantaneously replacing the machine with an excellent machine. The quality of the machine deteriorates over time, as shown in the file P10 41.xlsx. Four maintenance policies are under consideration: Policy 1: Never replace a machine. Policy 2: Immediately replace a bad machine. Policy 3: Immediately replace a bad or average machine. Policy 4: Immediately replace a bad, average, or good machine. Simulate each of these policies for 50 weeks (using at least 250 iterations each) to determine the policy that maximizes expected weekly profit. Assume that the machine at the beginning of week 1 is excellent.The file P13_29.xlsx contains monthly time series data for total U.S. retail sales of building materials (which includes retail sales of building materials, hardware and garden supply stores, and mobile home dealers). a. Is seasonality present in these data? If so, characterize the seasonality pattern. b. Use Winters method to forecast this series with smoothing constants = = 0.1 and = 0.3. Does the forecast series seem to track the seasonal pattern well? What are your forecasts for the next 12 months?Management of a home appliance store would like to understand the growth pattern of the monthly sales of Blu-ray disc players over the past two years. Managers have recorded the relevant data in the file P13_33.xlsx. a. Create a scatterplot for these data. Comment on the observed behavior of monthly sales at this store over time. b. Estimate an appropriate regression equation to explain the variation of monthly sales over the given time period. Interpret the estimated regression coefficients. c. Analyze the estimated equations residuals. Do they suggest that the regression equation is adequate? If not, return to part b and revise your equation. Continue to revise the equation until the results are satisfactory.
