Dr. Pagels is a mammalogist who studies meadow and common voles. He frequently traps the moles and has noticed what appears to be a preference for a peanut butter-oatmeal mixture by the meadow voles vs apple slices are usually used in traps, where the common voles seem to prefer the apple slices. So he conducted a study where he used a peanut butter-oatmeal mixture in half the traps and the normal apple slices in his remaining traps to see if there was a food preference between the two different voles. Indicate which of the following is the null hypothesis, and which is the alternate hypothesis. There food preferences among vole species are independent of one another. There is a relationship between voles and food preference. To test for independence, we need to calculate the Chi-square statistic. These are the data that Dr. Pagels collected: meadow voles common voles apple slices 15 21 peanut butter-oatmeal 25 16
Dr. Pagels is a mammalogist who studies meadow and common voles. He frequently traps the moles and has noticed what appears to be a preference for a peanut butter-oatmeal mixture by the meadow voles vs apple slices are usually used in traps, where the common voles seem to prefer the apple slices. So he conducted a study where he used a peanut butter-oatmeal mixture in half the traps and the normal apple slices in his remaining traps to see if there was a food preference between the two different voles. Indicate which of the following is the null hypothesis, and which is the alternate hypothesis. There food preferences among vole species are independent of one another. There is a relationship between voles and food preference. To test for independence, we need to calculate the Chi-square statistic. These are the data that Dr. Pagels collected: meadow voles common voles apple slices 15 21 peanut butter-oatmeal 25 16

Holt Mcdougal Larson Pre-algebra: Student Edition 2012
1st Edition
ISBN:9780547587776
Author:HOLT MCDOUGAL
Publisher:HOLT MCDOUGAL
Chapter11: Data Analysis And Probability
Section11.4: Collecting Data
Problem 2E

Related questions
Question
Question 8: Can you answer all the parts to this question with all the answers bolded for part you're answering or clearly showing which part you're answering. The second part of the question is in the second image.
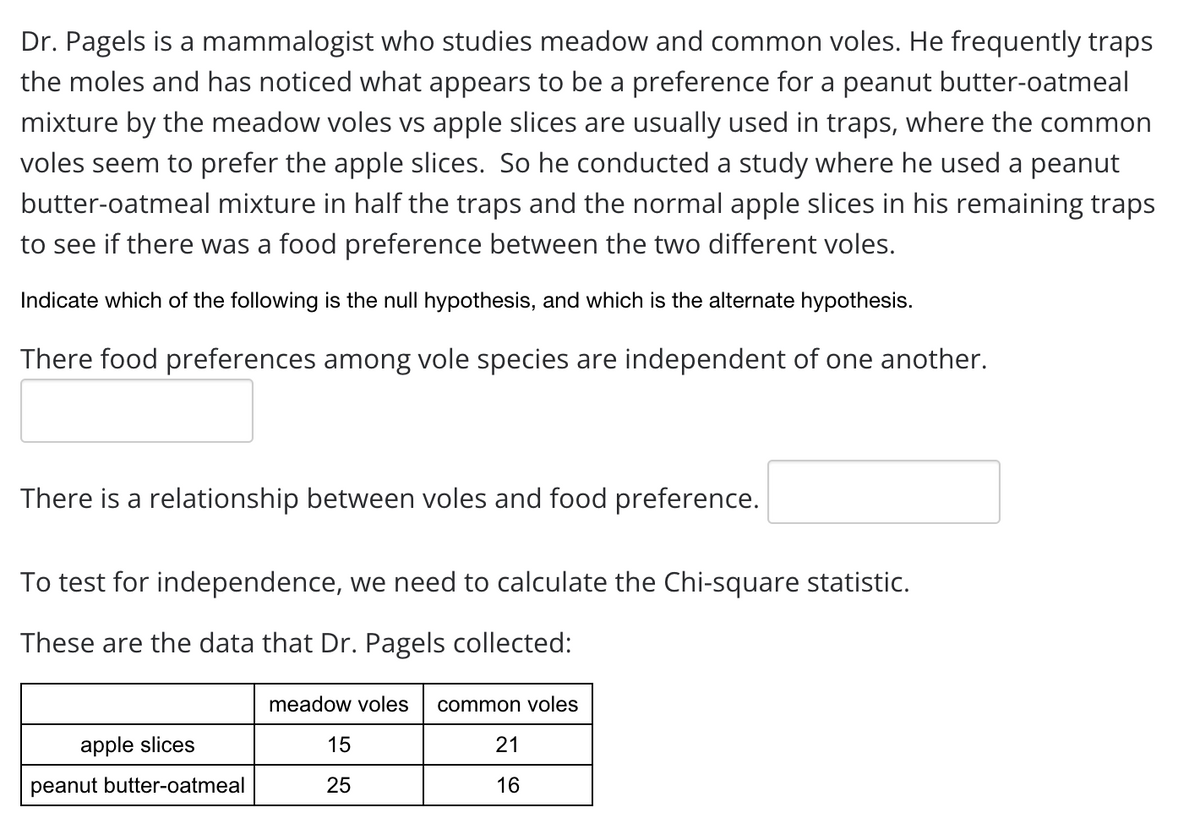
Transcribed Image Text:Dr. Pagels is a mammalogist who studies meadow and common voles. He frequently traps
the moles and has noticed what appears to be a preference for a peanut butter-oatmeal
mixture by the meadow voles vs apple slices are usually used in traps, where the common
voles seem to prefer the apple slices. So he conducted a study where he used a peanut
butter-oatmeal mixture in half the traps and the normal apple slices in his remaining traps
to see if there was a food preference between the two different voles.
Indicate which of the following is the null hypothesis, and which is the alternate hypothesis.
There food preferences among vole species are independent of one another.
There is a relationship between voles and food preference.
To test for independence, we need to calculate the Chi-square statistic.
These are the data that Dr. Pagels collected:
meadow voles
common voles
apple slices
15
21
peanut butter-oatmeal
25
16
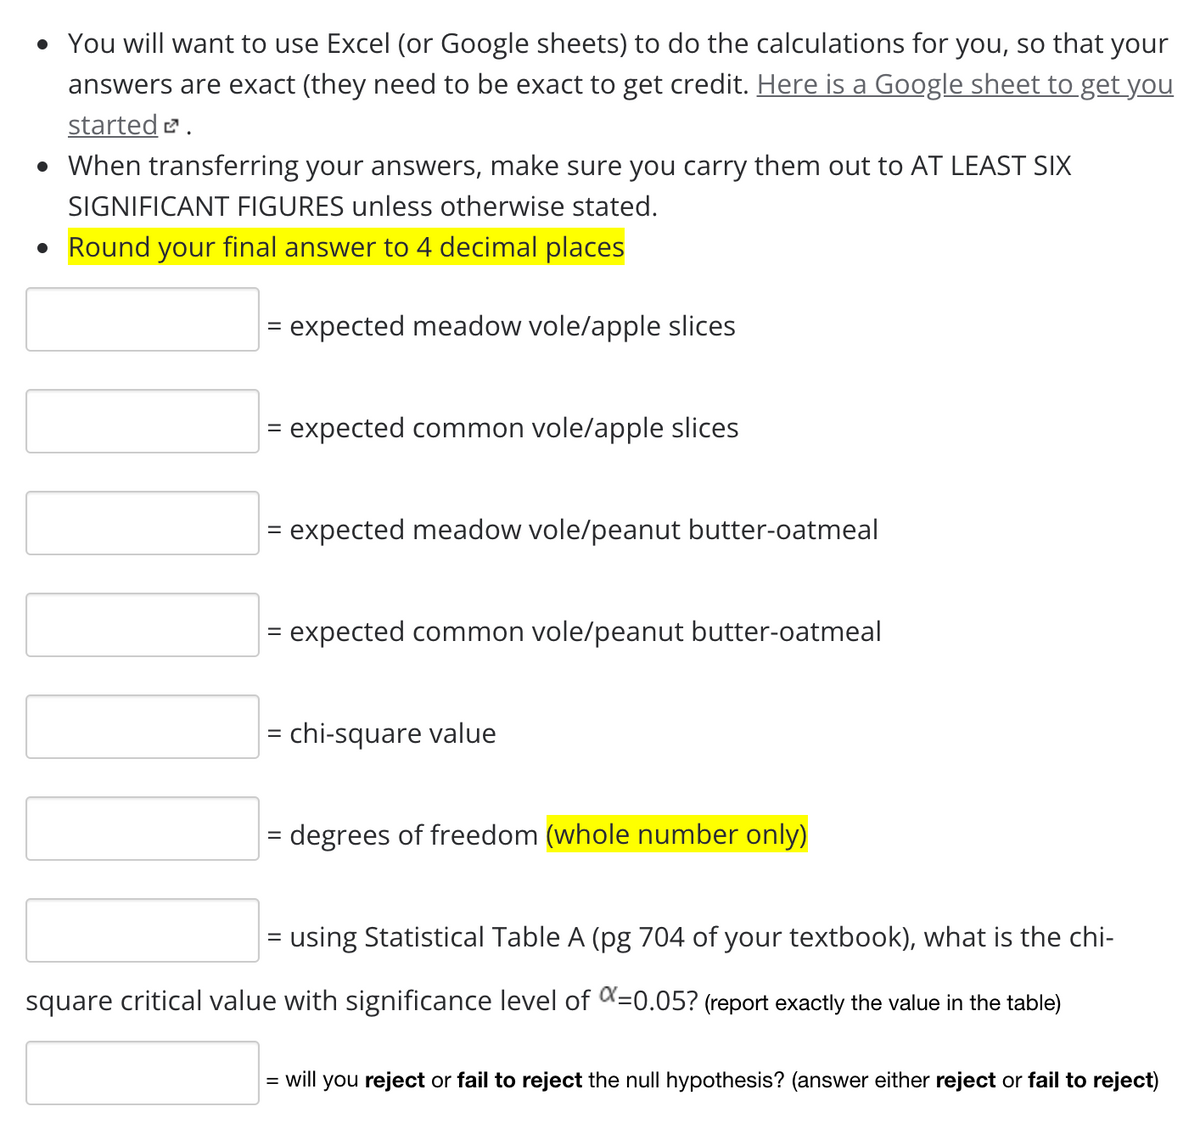
Transcribed Image Text:• You will want to use Excel (or Google sheets) to do the calculations for you, so that your
answers are exact (they need to be exact to get credit. Here is a Google sheet to get you
started .
• When transferring your answers, make sure you carry them out to AT LEAST SIX
SIGNIFICANT FIGURES unless otherwise stated.
• Round your final answer to 4 decimal places
= expected meadow vole/apple slices
= expected common vole/apple slices
= expected meadow vole/peanut butter-oatmeal
= expected common vole/peanut butter-oatmeal
= chi-square value
= degrees of freedom (whole number only)
= using Statistical Table A (pg 704 of your textbook), what is the chi-
%|
square critical value with significance level of K=0.05? (report exactly the value in the table)
= will you reject or fail to reject the null hypothesis? (answer either reject or fail to reject)
Expert Solution
This question has been solved!
Explore an expertly crafted, step-by-step solution for a thorough understanding of key concepts.

This is a popular solution!

Trending now
This is a popular solution!

Step by step
Solved in 3 steps with 2 images

Recommended textbooks for you
Holt Mcdougal Larson Pre-algebra: Student Edition…
Algebra
ISBN:
9780547587776
Author:
HOLT MCDOUGAL
Publisher:
HOLT MCDOUGAL
Holt Mcdougal Larson Pre-algebra: Student Edition…
Algebra
ISBN:
9780547587776
Author:
HOLT MCDOUGAL
Publisher:
HOLT MCDOUGAL