One year at a university, the algebra course director decided to experiment with a new teaching method that might reduce variability in final-exam scores by eliminating lower scores. The director randomly divided the algebra st who were registered for class at 9:40 A.M. into two groups. One of the groups, called the control group, was taught the usual algebra course; the other group, called the experimental group, was taught by the new teaching meth classes covered the same material, took the same unit quizzes, and took the same final exam at the same time. The final-exam scores (out of 40 possible) for the two groups are shown in the accompanying table. Find a 90% confidence interval for the ratio of the population standard deviations of final-exam scores for students taught by the conventional method and for students taught by the new method. Assume that both populations are normally distributed. (Note: s, =7.637, s2 = 7.240, and for df = (19,40), Fo.05 = 1.85.) Click here to view the data table. Click here to view page 1 of the F-distribution. Click here to view page 2 of the F-distribution. Click here to view page 3 of the F-distribution. Click here to view page 4 of the F-distribution. is 0.74 to 1.44. 02 The 90% confidence interval for
One year at a university, the algebra course director decided to experiment with a new teaching method that might reduce variability in final-exam scores by eliminating lower scores. The director randomly divided the algebra st who were registered for class at 9:40 A.M. into two groups. One of the groups, called the control group, was taught the usual algebra course; the other group, called the experimental group, was taught by the new teaching meth classes covered the same material, took the same unit quizzes, and took the same final exam at the same time. The final-exam scores (out of 40 possible) for the two groups are shown in the accompanying table. Find a 90% confidence interval for the ratio of the population standard deviations of final-exam scores for students taught by the conventional method and for students taught by the new method. Assume that both populations are normally distributed. (Note: s, =7.637, s2 = 7.240, and for df = (19,40), Fo.05 = 1.85.) Click here to view the data table. Click here to view page 1 of the F-distribution. Click here to view page 2 of the F-distribution. Click here to view page 3 of the F-distribution. Click here to view page 4 of the F-distribution. is 0.74 to 1.44. 02 The 90% confidence interval for

Glencoe Algebra 1, Student Edition, 9780079039897, 0079039898, 2018
18th Edition
ISBN:9780079039897
Author:Carter
Publisher:Carter
Chapter10: Statistics
Section: Chapter Questions
Problem 13PT

Related questions

Question
Interpret the confidence interval. Select the correct choice below and fill in the answer boxes to complete your choice.
Can you assist me on how the assignment chose 1.35 as the answer for the question? I was able to calculate the confidence interval for part A, but don't understand the second part. Thank you so much in advance.
Transcribed Image Text:11.2.69
EQuestion Help
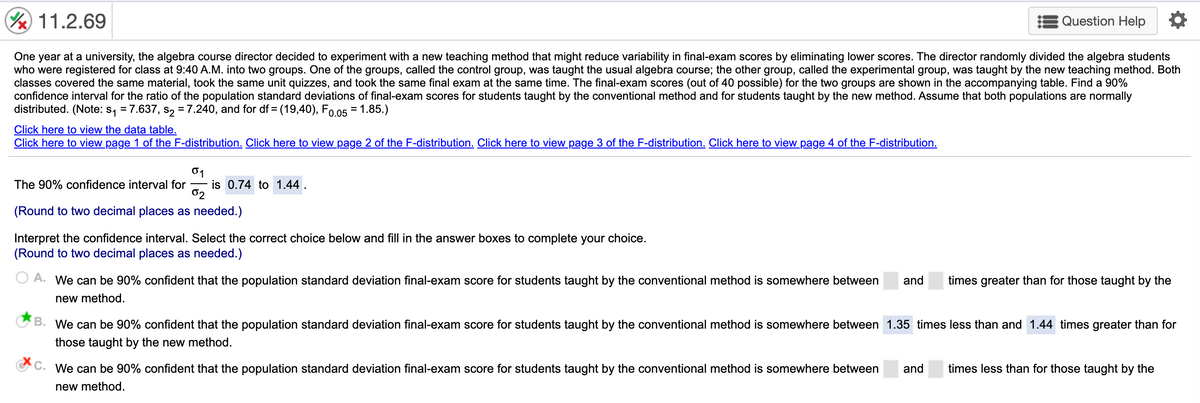
One year at a university, the algebra course director decided to experiment with a new teaching method that might reduce variability in final-exam scores by eliminating lower scores. The director randomly divided the algebra students
who were registered for class at 9:40 A.M. into two groups. One of the groups, called the control group, was taught the usual algebra course; the other group, called the experimental group, was taught by the new teaching method. Both
classes covered the same material, took the same unit quizzes, and took the same final exam at the same time. The final-exam scores (out of 40 possible) for the two groups are shown in the accompanying table. Find a 90%
confidence interval for the ratio of the population standard deviations of final-exam scores for students taught by the conventional method and for students taught by the new method. Assume that both populations are normally
distributed. (Note: s, = 7.637, s2 = 7.240, and for df = (19,40), Fo.05 = 1.85.)
%3D
Click here to view the data table.
Click here to view page 1 of the F-distribution. Click here to view page 2 of the F-distribution. Click here to view page 3 of the F-distribution. Click here to view page 4 of the F-distribution.
01
is 0.74 to 1.44 .
02
The 90% confidence interval for
(Round to two decimal places as needed.)
Interpret the confidence interval. Select the correct choice below and fill in the answer boxes to complete your choice.
(Round to two decimal places as needed.)
O A. We can be 90% confident that the population standard deviation final-exam score for students taught by the conventional method is somewhere between
and
times greater than for those taught by the
new method.
GB. We can be 90% confident that the population standard deviation final-exam score for students taught by the conventional method is somewhere between 1.35 times less than and 1.44 times greater than for
those taught by the new method.
OC. We can be 90% confident that the population standard deviation final-exam score for students taught by the conventional method is somewhere between
and
times less than for those taught by the
new method.
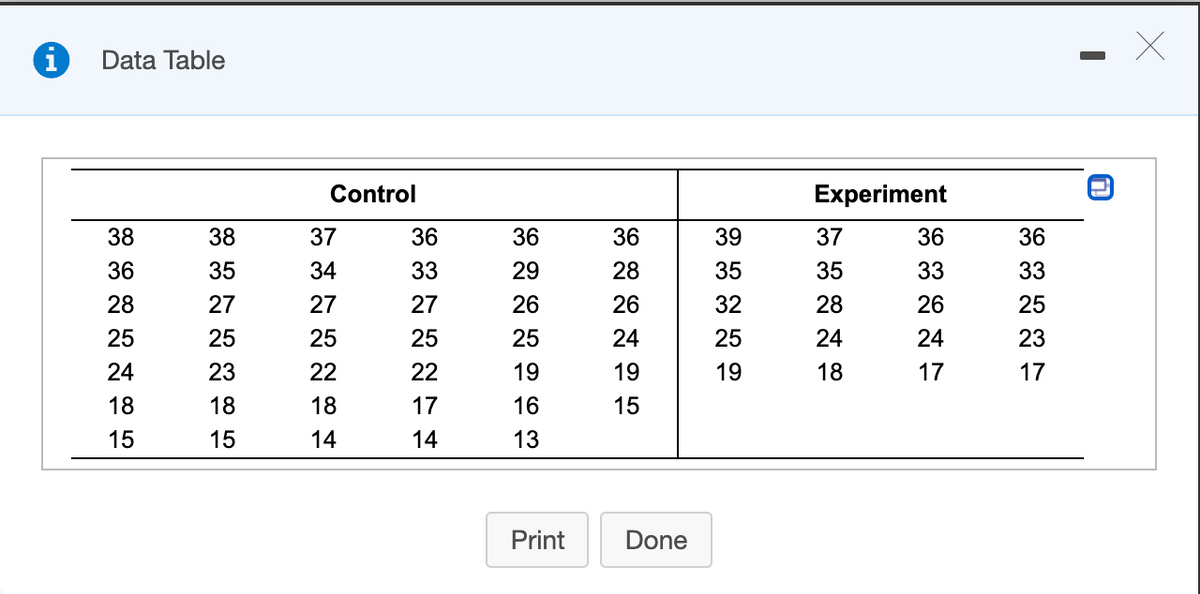
Transcribed Image Text:Data Table
Control
Experiment
38
38
37
36
36
36
39
37
36
36
36
35
34
33
29
28
35
35
33
33
28
27
27
27
26
26
32
28
26
25
25
25
25
25
25
24
25
24
24
23
24
23
22
22
19
19
19
18
17
17
18
18
18
17
16
15
15
15
14
14
13
Print
Done
Expert Solution
This question has been solved!
Explore an expertly crafted, step-by-step solution for a thorough understanding of key concepts.

This is a popular solution!

Trending now
This is a popular solution!

Step by step
Solved in 2 steps

Knowledge Booster


Learn more about
Need a deep-dive on the concept behind this application? Look no further. Learn more about this topic, statistics and related others by exploring similar questions and additional content below.Recommended textbooks for you
Glencoe Algebra 1, Student Edition, 9780079039897…
Algebra
ISBN:
9780079039897
Author:
Carter
Publisher:
McGraw Hill

Holt Mcdougal Larson Pre-algebra: Student Edition…
Algebra
ISBN:
9780547587776
Author:
HOLT MCDOUGAL
Publisher:
HOLT MCDOUGAL

Algebra & Trigonometry with Analytic Geometry
Algebra
ISBN:
9781133382119
Author:
Swokowski
Publisher:
Cengage
Glencoe Algebra 1, Student Edition, 9780079039897…
Algebra
ISBN:
9780079039897
Author:
Carter
Publisher:
McGraw Hill
Holt Mcdougal Larson Pre-algebra: Student Edition…
Algebra
ISBN:
9780547587776
Author:
HOLT MCDOUGAL
Publisher:
HOLT MCDOUGAL
Algebra & Trigonometry with Analytic Geometry
Algebra
ISBN:
9781133382119
Author:
Swokowski
Publisher:
Cengage