Dr. Wong's assistant made the observations below while heating a sample of solid hydrogen. Using the data and observations in the table below, create a heating curve for hydrogen that Dr. Wong can reference during his laboratory testing. Be sure to include and label the following items in your heating curve: Create temperature and time intervals that are appropriate for the data. Don't start the temperature on the graph at 0 °C because the time intervals will be too large for the hydrogen data. Label the melting and boiling points on the curve. Label the three states and the two transition phases on the curve. Heating data: Time (Minutes) Observations 0:00 Hydrogen is a solid at −263 °C. Heat is added to sample. 2:43 Hydrogen begins to change into a liquid at −259 °C. 6:15 Temperature of the liquid begins to increase. 10:36 Hydrogen begins to form a gas at −253 °C. 14:01 Temperature of the gas begins to increase. 18:00 Final temperature of hydrogen gas is −245 °C. Hand written graph
Dr. Wong's assistant made the observations below while heating a sample of solid hydrogen. Using the data and observations in the table below, create a heating curve for hydrogen that Dr. Wong can reference during his laboratory testing. Be sure to include and label the following items in your heating curve: Create temperature and time intervals that are appropriate for the data. Don't start the temperature on the graph at 0 °C because the time intervals will be too large for the hydrogen data. Label the melting and boiling points on the curve. Label the three states and the two transition phases on the curve. Heating data: Time (Minutes) Observations 0:00 Hydrogen is a solid at −263 °C. Heat is added to sample. 2:43 Hydrogen begins to change into a liquid at −259 °C. 6:15 Temperature of the liquid begins to increase. 10:36 Hydrogen begins to form a gas at −253 °C. 14:01 Temperature of the gas begins to increase. 18:00 Final temperature of hydrogen gas is −245 °C. Hand written graph

Chapter6: The States Of Matter
Section: Chapter Questions
Problem 6.78E

Related questions
Question
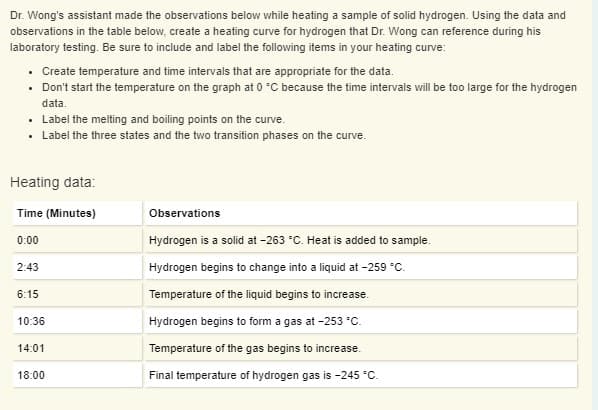
Dr. Wong's assistant made the observations below while heating a sample of solid hydrogen. Using the data and observations in the table below, create a heating curve for hydrogen that Dr. Wong can reference during his laboratory testing. Be sure to include and label the following items in your heating curve:
- Create temperature and time intervals that are appropriate for the data.
- Don't start the temperature on the graph at 0 °C because the time intervals will be too large for the hydrogen data.
- Label the melting and boiling points on the curve.
- Label the three states and the two transition phases on the curve.
Heating data:
| Time (Minutes) | Observations |
|---|---|
| 0:00 | Hydrogen is a solid at −263 °C. Heat is added to sample. |
| 2:43 | Hydrogen begins to change into a liquid at −259 °C. |
| 6:15 | Temperature of the liquid begins to increase. |
| 10:36 | Hydrogen begins to form a gas at −253 °C. |
| 14:01 | Temperature of the gas begins to increase. |
| 18:00 | Final temperature of hydrogen gas is −245 °C. |
Hand written graph
Transcribed Image Text:Dr. Wong's assistant made the observations below while heating a sample of solid hydrogen. Using the data and
observations in the table below, create a heating curve for hydrogen that Dr. Wong can reference during his
laboratory testing. Be sure to include and label the following items in your heating curve:
• Create temperature and time intervals that are appropriate for the data.
• Don't start the temperature on the graph at 0 °C because the time intervals will be too large for the hydrogen
data.
• Label the melting and boiling points on the curve.
• Label the three states and the two transition phases on the curve.
Heating data:
Time (Minutes)
Observations
0:00
Hydrogen is a solid at -263 °C. Heat is added to sample.
2:43
Hydrogen begins to change into a liquid at -259 °C.
6:15
Temperature of the liquid begins to increase.
10:36
Hydrogen begins to form a gas at -253 °C.
14:01
Temperature of the gas begins to increase.
18:00
Final temperature of hydrogen gas is -245 °C.
Expert Solution
This question has been solved!
Explore an expertly crafted, step-by-step solution for a thorough understanding of key concepts.

This is a popular solution!

Trending now
This is a popular solution!

Step by step
Solved in 2 steps with 1 images

Knowledge Booster


Learn more about
Need a deep-dive on the concept behind this application? Look no further. Learn more about this topic, chemistry and related others by exploring similar questions and additional content below.Recommended textbooks for you

Chemistry for Today: General, Organic, and Bioche…
Chemistry
ISBN:
9781305960060
Author:
Spencer L. Seager, Michael R. Slabaugh, Maren S. Hansen
Publisher:
Cengage Learning

Chemistry by OpenStax (2015-05-04)
Chemistry
ISBN:
9781938168390
Author:
Klaus Theopold, Richard H Langley, Paul Flowers, William R. Robinson, Mark Blaser
Publisher:
OpenStax
Chemistry for Today: General, Organic, and Bioche…
Chemistry
ISBN:
9781305960060
Author:
Spencer L. Seager, Michael R. Slabaugh, Maren S. Hansen
Publisher:
Cengage Learning
Chemistry by OpenStax (2015-05-04)
Chemistry
ISBN:
9781938168390
Author:
Klaus Theopold, Richard H Langley, Paul Flowers, William R. Robinson, Mark Blaser
Publisher:
OpenStax

Chemical Principles in the Laboratory
Chemistry
ISBN:
9781305264434
Author:
Emil Slowinski, Wayne C. Wolsey, Robert Rossi
Publisher:
Brooks Cole

Chemistry for Engineering Students
Chemistry
ISBN:
9781337398909
Author:
Lawrence S. Brown, Tom Holme
Publisher:
Cengage Learning

Chemistry
Chemistry
ISBN:
9781305957404
Author:
Steven S. Zumdahl, Susan A. Zumdahl, Donald J. DeCoste
Publisher:
Cengage Learning