Draw a curve that shows that the number of new television shows produced and the quantity of apples grown in British Columbia are unrelated. Television shows (number per month) 4.0- 3.0- 2.0- 1.0- 0.0- Apples (thousands of boxes per month) >>> Draw only the objects specified in the question. .....
Draw a curve that shows that the number of new television shows produced and the quantity of apples grown in British Columbia are unrelated. Television shows (number per month) 4.0- 3.0- 2.0- 1.0- 0.0- Apples (thousands of boxes per month) >>> Draw only the objects specified in the question. .....

Microeconomics: Principles & Policy
14th Edition
ISBN:9781337794992
Author:William J. Baumol, Alan S. Blinder, John L. Solow
Publisher:William J. Baumol, Alan S. Blinder, John L. Solow
Chapter1: What Is Economics?
Section1.A: Appendix Using Graphs: A Review
Problem 3TY

Related questions
Question
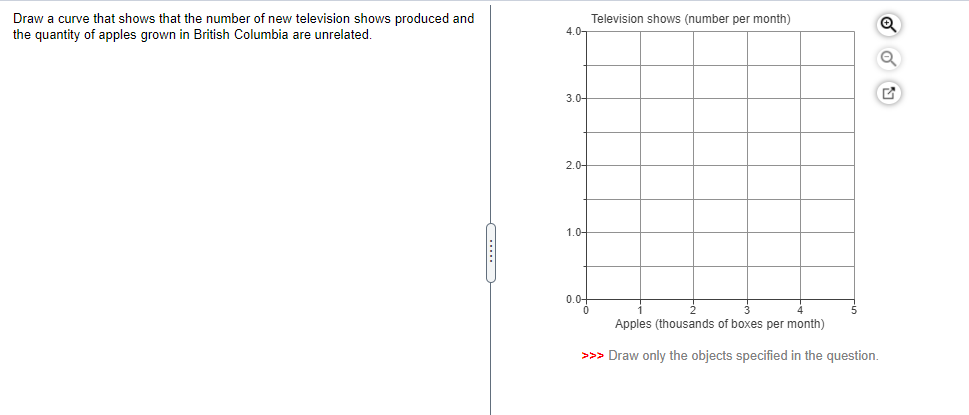
Transcribed Image Text:Television shows (number per month)
Draw a curve that shows that the number of new television shows produced and
the quantity of apples grown in British Columbia are unrelated.
4.0-
3.0-
2.0-
1.0-
0.0-
Apples (thousands of boxes per month)
>>> Draw only the objects specified in the question.
Expert Solution
This question has been solved!
Explore an expertly crafted, step-by-step solution for a thorough understanding of key concepts.

This is a popular solution!

Trending now
This is a popular solution!

Step by step
Solved in 2 steps with 1 images

Recommended textbooks for you
Microeconomics: Principles & Policy
Economics
ISBN:
9781337794992
Author:
William J. Baumol, Alan S. Blinder, John L. Solow
Publisher:
Cengage Learning


Microeconomics: Principles & Policy
Economics
ISBN:
9781337794992
Author:
William J. Baumol, Alan S. Blinder, John L. Solow
Publisher:
Cengage Learning

Economics (MindTap Course List)
Economics
ISBN:
9781337617383
Author:
Roger A. Arnold
Publisher:
Cengage Learning

Macroeconomics: Principles and Policy (MindTap Co…
Economics
ISBN:
9781305280601
Author:
William J. Baumol, Alan S. Blinder
Publisher:
Cengage Learning
