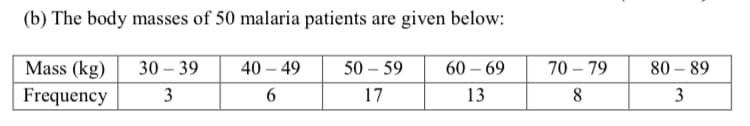
(b) The body masses of 50 malaria patients are given below: Mass (kg) 30 – 39 40 - 49 50 – 59 60 – 69 70 – 79 80 – 89 Frequency 3 17 13 8. 3


Q: The following data shows the ages of customers who owns a motorcycle. 31 42 62 21 60 66 68 63 54 22…
A: Data is given for ages of coustomers who owns a motorcycle. We have to construct histogram,…
Q: The data shown are the number of grams per serving of 50 selected brand of cakes. 67 27 15 75 58 64…
A: Range=Maximum value - Minimum value=254-3=251 Then, Then, the frequency distribution table is…
Q: The age of the population in Wakanda is shown in the following table in the form of a grouped…
A: Given: The provided data is: Age Number 0 - 5 1375.3 5-15 2750.5 15 - 30 4514.72 30 - 50…
Q: Determine the class width of each class.
A:
Q: A sample of 20 cans of cat food from a large production run yielded the following weights in grams…
A: A frequency table is a tabular way to represent the data set or observation, which shows the number…
Q: Convert the following distribution of scores into a grouped frequency table and (a) Determine the…
A: We know that range= (Max-min) And mid point=(upper limit +lowerlimit)/2
Q: * Draw a Frequency polygon, histogram and a cumu requency distribution for the following data: Class…
A: Frequency Polygon: Excel Procedure: Enter class and frequency in Excel>Select the data in…
Q: Prepare a frequency distribution of the following data of time spent on internet (in minutes) by 50…
A:
Q: Use the accompanying frequency polygon to answer the following questions. Number of E-mail Messages…
A: “Since you have posted a question with multiple sub-parts, we will solve first three subparts for…
Q: 2. In Tagum City, 86 houses are for sale, each having about 2000 sq.ft. of floor area. The asking…
A: Given frequency table: Class Frequency 50,000-100,000 21 100,000-150,000 27 150,000-200,000…
Q: Prepare a grouped frequency table for the data given below, taking 10 units as the width of class…
A: The given raw data can be written in ascending order as; 36 46 53 59 75 84 38 47 53 61 77 86…
Q: The age of the population in Wakanda is shown in the following table in the form of a grouped…
A: Hi! Thank you for the question, As per the honour code, we are allowed to answer three sub-parts at…
Q: Here is a data set: 417 456 512 453 465 486 470 416 447 433 437 414 464 562 409 364 426 485 354 541…
A:
Q: 12. FILE The Quick Change Oil Company has a number of outlets in the metropolitan Seat- tle area.…
A: Since you have posted a question with multiple sub parts, according to our guidelines we can solve…
Q: Use the following frequency distribution table of exam scores of students in section A to answer…
A: to find how many students has score less than 20 we need to find cumulative frequency for this
Q: Consider the grouped frequency distribution below, in which the speed (in km/hr) of 40 cars are…
A: Given that Total number of car=40 The speed limit of car is 120km/h Find the percentage of car…
Q: Construct a grouped frequency distribution table using 6 classes/groups. Follow the steps carefully.…
A: Given86,83,81,81,86,91,79,82,81,87,87,83,82,72,73,78,87,70,90,75,80,82,89,98,89,80,96,76,99,71,88,85…
Q: 1. The height of 30 students of Mathematics, Science & Computer Department was measured in cm. The…
A: Given information: 163, 163, 164, 165, 166, 168, 169, 170, 170, 171, 171, 172, 173, 175, 175, 175,…
Q: The following frequency distribution shows the length (in feet) of the main spans of the longest…
A: Enter the data in Excel.
Q: Construct a Histogram for the following frequency distribution of the heights of 100 male students…
A: Height(inches) No. of students 60-62 5 63-65 18 66-68 42 69-71 27 72-74 8
Q: A survey was given to 215 students at a local high school, asking how many hours of television they…
A: Histograms are used to represent data graphically using bars of different heights.
Q: The frequency distribution which is visualized in the form of an overlapping bar graph is also known…
A: We have given that the statement about to the graph. Here, need to find out the correct frequency…
Q: 3. Consider the following frequency ogive and answer the questions that follow. 45 40 38 40 36 35 30…
A: Given the less than frequency ogive.
Q: = 25 AA batteries were tested to determine how long they would last. The results, to the nearest…
A: Given data is…
Q: a. Using the inclusive method of classification, construct a suitable grouped Frequency distribution…
A: Given : We have given 58 selected students weight in Kg. First we find ,Total class =58 =7.6157 ≈…
Q: The number of text messages sent by 25 13-year-olds over the past month are as follows: 753 615 875…
A: Note: Hi there! Thank you for posting the question. As there are multiple sub parts, according to…
Q: elow are the scores of 50 students in Statistics Test. Construct a frequency distribution table.…
A: Given: 56 48 47 42 52 58 42 37 68 40 32 46 45 41 38 34 54 57 61 53 26 45 46 44 50 30 40 56 44 39 21…
Q: Use the accompanying frequency polygon to answer the following questions. Number of E-mail Messages…
A: Disclaimer: Since you have posted a question with multiple subparts, we will solve first 3 subparts…
Q: The age of the population in Wakanda is shown in the following table in the form of a grouped…
A: Since you have posted a question with multiple sub-parts, we will solve first three subparts for…
Q: The age of the population in Wakanda is shown in the following table in the form of a grouped…
A: Given: The provided data is: Class Number('000) 0-5 1375.3 5-15 2750.5 15-30 4514.7 30-50…
Q: The IQ scores of 50 students are given below. 115 101 105 109 101 117 113 89 115 112…
A: Solution Given observation 115 101 105 109 101 117 113 89 115 112 103 95 88 117 89 107 115 103…
Q: consider the following frequency table representing the distribution of the cost of a paperback…
A: Class width of each class is the difference between consecutive upper or lower classes.
Q: An instructor has obtained the set of N= 25 exam scores shown here from a 75-point Social Psychology…
A: The objective is to create frequency distribution table and find range ,class width,upper and lower…
Q: 1 The following data give the results of a sample survey. The letters A B and C represent the three…
A: Given; Data on sample survey. Number of items in category A=8 Number of items in category B=8 Number…
Q: 2. The number of class intervals in a frequency distribution (or bar chart) will be approximately…
A: Range = Maximum -Minimum
Q: Construct a frequency distribution and a relative frequency histogram for the accompanying data set…
A: The minimum value in the given data is 138 so the lower limit of the first class will be 138. The…
Q: The age of the population in Wakanda is shown in the following table in the form grouped frequency…
A:
Q: In a survey of 35 families in a village, the number of children per family was recorded and the…
A: Given Data 1,0,2,3,4,5,6,7,2,3,4,0,2,5,8,4,5,12,6,3,2,7,6,5,3,3,7,8,9,7,9,4,5,4,3 We want to make…
Q: Consider the following frequency table representing the distribution of hours students study for an…
A: The table shows the distribution of hours students’ study for an exam in a week.
Q: Q. Using the data given below answer the questions asked. 56 48 47 42 52 58 42 37 68 40 32 46 45 41…
A: solution is as follows,
Q: Refer to the incomplete grouped frequency distribution below. Classes (Rand) Frequency Cumulative…
A:
Q: the 50 US states: 106 98 96 108 90 93 89 103 104 119 111 85 97 102 85 109 93 120 98 102 90 96 114…
A: Given data is appropriate to for measures of central tendency .to find the central value.
Q: Below are the scores of 50 students in Statistics Test. Construct a frequency distribution table.…
A: Note: according to Bartleby, expert solve only one question and maximum 3 subpart of the first…
Q: Consider the frequency distribution showing lengths of cuckoo eggs. Mean 22.453 Std. Dev.1.0662…
A: It is an important part of statistics. It is widely used.
Q: Consider the following frequency table representing the distribution of hours students spend on…
A: The class width is the difference between successive classes between the upper or lower class…
Q: Given the following set of data on weights of 57 children at an orphanage: 68 63 42 27…
A: Given, 68 63 42 27 30 36 28 32 79 27 22 23 24…
Q: Table is a frequency distribution of heights of 100 male students at kufa University. Height (in)…
A: a) class width is given by the formula = upper limit of class - lower limit of the class…
Q: Identify the class width, class midpoints, and class boundaries for the given frequency…
A: Class width of each class is the difference between consecutive upper or lower classes.
Q: 1. Construct the frequency distribution table using the information given of the number of students…
A: According to our guidelines, only one question can be answered at a time, so please post the…

Step by step
Solved in 2 steps with 1 images


- Q// In a prefabricated building factory, 1000 molds, 400 of which are made of wood, found that 10% of the molds are unsuitable for use, and that half of the unusable molds are wooden blocks Equal ?The Etruscans. Anthropologists are still trying to unravel the mystery of the origins of the Etruscan empire, a highly advanced Italic civilization formed around the eighth century B.C. in central Italy. Were they native to the Italian peninsula or, as many aspects of their civilization suggest, did they migrate from the East by land or sea? The maximum head breadth, in millimeters, of 70 modern Italian male skulls and 84 preserved Etruscan male skulls was analyzed to help researchers decide whether the Etruscans were native to Italy. The resulting data can be found on the WeissStats site. [SOURCE: N. Barnicot and D. Brothwell, “The Evaluation of Metrical Data in the Comparison of Ancient and Modern Bones.” In Medical Biology and Etruscan Origins, G. Wolstenholme and C. O’Connor, eds., Little, Brown&Co., 1959] a. Obtain normal probability plots, boxplots, and the standard deviations for the two samples. b. Based on your results from part (a), which would you be inclined to use to…Calculate the 95% interval estimate for the population proportion of getting “1”s from throwing a goat astragalus based on the sample of 1,000 throws described in Question 11
- The table below contains the total cost ($) for four tickets to a basketball game purchased on the secondary market, two beers, two soft drinks, two hot dogs, and one parking space at each arena during a recent season. 298.97364.59427.79213.23307.54531.23297.49302.56521.19291.69366.83532.67230.38320.12507.88212.87452.34656.21245.26436.92709.57220.91485.82727.63365.07487.58788.14360.31467.92886.93 a. Organize these costs as an ordered array. b. Construct a frequency distribution and a percentage distribution for these costs. c. Around what values, if any, are at least 75% of the costs of attending the game concentrated? Explain.The Etruscans. Anthropologists are still trying to unravel the mystery of the origins of the Etruscan empire, a highly advanced Italic civilization formed around the eighth century B.C. in central Italy. Were they native to the Italian peninsula or, as many aspects of their civilization suggest, did they migrate from the East by land or sea? The maximum head breadth, in millimeters, of 70 modern Italian male skulls and that of 84 preserved Etruscan male skulls were analyzed to help researchers decide whether the Etruscans were native to Italy. The resulting data can be found on the WeissStats site. [SOURCE: N. Barnicot and D. Brothwell, “The Evaluation of Metrical Data in the Comparison of Ancient and Modern Bones.” In a. use the technology of your choice to obtain boxplots for the data sets, using the same scale. b. compare the data sets by using your results from part (a), paying special attention to center and variation.The Etruscans. Anthropologists are still trying to unravel the mystery of the origins of the Etruscan empire, a highly advanced Italic civilization formed around the eighth century B.C. in central Italy. Were they native to the Italian peninsula or, as many aspects of their civilization suggest, did they migrate from the East by land or sea? The maximum head breadth, in millimeters, of 70 modern Italian male skulls and that of 84 preserved Etruscan male skulls were analyzed to help researchers decide whether the Etruscans were native to Italy. The resulting data can be found on the WeissStats site. [SOURCE: N. Barnicot and D. Brothwell, “The Evaluation of Metrical Data in the Comparison of Ancient and Modern Bones.” In Medical Biology and Etruscan Origins, G. Wolstenholme and C. O’Connor, eds., Little, Brown&Co., 1959] a. use the technology of your choice to obtain boxplots for the data sets, using the same scale. b. compare the data sets by using your results from part (a), paying…
- The Etruscans. Anthropologists are still trying to unravel the mystery of the origins of the Etruscan empire, a highly advanced Italic civilization formed around the eighth century B.C. in central Italy. Were they native to the Italian peninsula or, as many aspects of their civilization suggest, did they migrate from the East by land or sea? The maximum head breadth, in millimeters, of 70 modern Italian male skulls and that of 84 preserved Etruscan male skulls were analyzed to help researchers decide whether the Etruscans were native to Italy. The resulting data can be found on theWeissStats site. [SOURCE: N. Barnicot and D. Brothwell, “The Evaluation of Metrical Data in the Comparison of Ancient and Modern Bones.” In Medical Biology and Etruscan Origins, G. Wolstenholme and C. O’Connor, eds., Little, Brown&Co., 1959] a. use the technology of your choice to determine the mean and median of each of the two data sets. b. compare the two data sets by using your results from part (a).Fill the chi square for Cross 1 and Cross 2 from the following data in the attached image: Cross 1: Phenotypes Ratio Observed Expected (O-E)2/E Totals X2 = Cross 2: Phenotypes Ratio Observed Expected (O-E)2/E Totals X2 =Albone Age(Rings) Shell Weight(g) 10 0.205 11 0.285 9 0.09 10 0.16 8 0.135 11 0.285 12 0.26 12 0.345 10 0.165 17 0.41 11 0.2425 13 0.34 12 0.62 10 0.3 12 0.245 13 0.31 11 0.18 12 0.125 9 0.07 11 0.26 15 0.45 10 0.205 9 0.075 19 0.345 7 0.08 13 0.33 22 0.27 12 0.35 10 0.25 10 0.105 10 0.2 20 0.4 18 0.385 19 0.285 11 0.24 17 0.625 17 0.3 17 0.37 15 0.365 3 0.01 9 0.11 8 0.027 13 0.22 20 0.415 11 0.2 12 0.36 4 0.012 15 0.14 6 0.055 5 0.025 12 0.09 12 0.245 11 0.295 9 0.123 7 0.03 13 0.255 8 0.06 20 0.525 9 0.07 13 0.3 12 0.256 6 0.03 7 0.0745 9 0.1465 9 0.202 10 0.33 11 0.3685 10 0.4 6 0.0245 5 0.045 6 0.1 7 0.119 6 0.17 8 0.156 8 0.202 7 0.214 9 0.274 9 0.315 8 0.336 11 0.4005 4 0.0095 6 0.0405 7 0.1045 7 0.1175 6 0.1385 9 0.169 8 0.206 8 0.265 9 0.292 9 0.332 8 0.34 11 0.4525 11 0.586 7 0.048 7…
- The mean ±1 sd of ln [calcium intake (mg)] among 25females, 12 to 14 years of age, below the poverty level is6.56 ± 0.64. Similarly, the mean ± 1 sd of ln [calcium intake(mg)] among 40 females, 12 to 14 years of age, above thepoverty level is 6.80 ± 0.76.8.6 Compute a 95% CI for the difference in meansbetween the two groupsI submitted this question for a),b), c),d),e) & f) in 2 parts already. Since I can only submit 3 parts at a time I am only looking for the answer to g) in this submission. Thank you A professor at a large university assigns a project to his class because he is interested to discover what proportion of students at the university are willing to report cheating by other students. One group posed this question to an SRS of 189 undergraduate students, "You witness two students cheating on a quiz. Do you go to the professor?" Only 22 answered "Yes." a) Identify the point estimator you would use. b) Calculate the value of the point estimate. c) Identify the population and parameter of interest. d) Identify each of the conditions that must be met to use this procedure and explain how you know that each one has been satisfied. e) Find the label the appropriate critical value and the standard error for a 90% confidence interval. Show your methods and label clearly. f) Calculate the 90%…There was a compete e^AT part