draw in a magnetic core by electronic means. They meas netic winding with and without the electronics in a paired e ase without electronics are provided in the following table Supply Voltage Current Without Electronic (mA) 0.66 7.32 1.32 12.22 1.98 16.34 2.64 23.66 3.3 28.06 3.96 33.39 4.62 34.12 3.28 39.21 5.94 44.21 6.6 47.48 regression line to predict current without electronics to sup significant
Q: (a) Find the moment generating function of U = X +3Y+Z. State clearly and justify all steps taken.…
A:
Q: (a) What is the probability a randomly selected student in the city will read more than 96 words per…
A: It is given that Mean, μ = 91 Standard deviation, σ = 10 Sample size, n = 11
Q: 3.65 One of the major measures of the quality of service provided by an organization is the speed…
A:
Q: The chi-square distribution can be used for the following except for?
A: Here use basic of chi - square distribution
Q: The F-statistic from an ANOVA is essentially a ratio of _________ variance. Effect/Total
A: Formula: The formula for F statistic in ANOVA is, F=Mean sum of squares for treatment(effect)Mean…
Q: Q4: Let X be a discrete random variable with probability mass function given in the following table:…
A: Hello! As you have posted more than 3 sub parts, we are answering the first 3 sub-parts. In case…
Q: Is this correct or incorrect? Why?
A: Here use basic of confidence interval
Q: You are conducting a Goodness of Fit Chi-Squared hypothesis test (αα = 0.05) for the claim that all…
A: For the given data Perform Chi square goodness of fit
Q: 6) A certain kind of light bulb lasts 1 year on average. What is the probability that a given light…
A: "Since you have asked multiple questions, we will solve the first question for you. If you want any…
Q: Do students with higher college grade point averages (GPAs) earn more than those graduates with…
A: Given data : GPA Salary ($) 2.22 72,000 2.29 48,000 2.57 72,000 2.59 64,000 2.77 88,000…
Q: Let X be a stochastic variable with a N(8,16) distribution. Suppose P(X<b) = 0.719. Calculate the…
A:
Q: An electronics store sells a particular model of a laptop computer. There are only four laptops in…
A:
Q: Calculate the median for the following data, which represents the time taken to go to work for fifty…
A: Given that Table for time taken to work for 50 people. Time spent Repetition Less than c.f.…
Q: 4. Calculate the Variance: 5. Calculate the Standard Deviation:
A: From Part (2), the mean is 39.2.
Q: Number of People Killed 350 300 250 200 150 100 50 0 -50 -100 -150 3 2 4 5 6 8 9 Magnitude of…
A: The objective is to identify the appropriate option, that represents the "earthquake occurring…
Q: 20. An organization claims that teenagers spend on average 6.5 hours per week on the phone. To test…
A: Given : sample size, n =40 sample mean, x̄ =7 population standard deviation,σ=2…
Q: What are some possible research topics that uses a secondary source?
A: Secondary source for a research: The research based on such data which is pre-recorded are the…
Q: An article in the Food Technology Journal (1956, Vol. 10, pp. 39-42) described a study on the…
A: a) Solution: Since p-value<α, H0 is rejected. Some of the groups' averages consider to be not…
Q: In an article in IEEE Transactions on Instrumentation and Measurement (2001, Vol. 50, pp. 986-990),…
A: Given that Supply Voltage(v) Current without Electronic(mA) 0.66 7.32 1.32 12.22 1.98 16.34…
Q: Assume that we want to construct a confidence interval. Do one of the following, as appropriate: (a)…
A: The confidence level is 0.90.
Q: fast-food
A:
Q: CHA 2 12--011 c) (pop 100--2011--2001-200-20GHA
A:
Q: Independent random samples from normal populations produced the results shown in the table to the…
A: Given n1=5 n2=4
Q: TABLE 2.5 Student teachers are trained to develop lesson plans, on the assumption that the writ- ten…
A:
Q: Determine the magnitude of the vector difference V' =V₂ - V₁ and the angle 0x which V' makes with…
A:
Q: 1. The manufacturer of a certain brand of light bulbs claim that the variance of the lives of these…
A:
Q: The following is a list of 20 scores of a pre-board examination of Certified Public Accountant (CPA)…
A:
Q: Assume that we want to construct a confidence interval. Do one of the following, as appropriate: (a)…
A: Given: The confidence level is 90%, σ = 3960 thousand dollars, and the histogram of 58 player…
Q: If the standard error of the mean for the sampling distribution of random samples of size 25 from a…
A:
Q: Suppose that y, is an independent response variable (i = 1.....n) with mean , such that g(i) = n₂ =…
A:
Q: (c) Suppose you select a sample of 430 complaints involving new car dealers. Show the sampling…
A:
Q: The following data set shows the weekly advertising expenditure and sales of 12 retail merchants…
A: With the help of data and scatter plot, we need to answer given questions.
Q: Suppose that an airline uses a seat width of 16.1 in. Assume men have hip breadths that are normally…
A:
Q: Determine if the samples are independent or related 1. The school principal wishes to determine if…
A: The school principal wishes to determine if the grade 6 boys are better in mathematics than the…
Q: A school has 600 pupils. The number in each year group is shown below: Year 7 8 9 10 11 Number of…
A:
Q: Is it possible to have more than one unbiased estimator for an unknown parameter? Or is not…
A:
Q: An electronics store sells a particular model of a laptop computer. There are only four laptops in…
A: To find: 1. Mean 2. Variance 3.Standard deviation
Q: Use the frequency distribution shown below to construct an expanded frequency distribution. High…
A:
Q: accounting firm annually monitors a certain mailing service's performance. One parameter of…
A:
Q: Suppose Z∼N(0,1). Then P(2 ≤ Z ≤ 3) is the same as
A:
Q: Suppose that an airline uses a seat width of 16.6 in. Assume men have hip breadths that are normally…
A: Given that mean =14.2 ,s.d = 0.9 , n =110
Q: You may need to use the appropriate appendix table or technology to answer this question. Suppose we…
A: Given Data : Population Mean,μ = 51800 Population Standard Deviation,σ = 4000
Q: Q14. In testing, H: H=2 vs H₁:u>2 using a = 0.1, a random sample of size n-6 from normal population…
A:
Q: o conduct a test of hypothesis with a single sample mean with N=20, what are the degrees of freedom…
A: As per our guidelines we can solve first multiple-choice question and rest can be reposted.…
Q: Consider the ages of 18 employees in a fast-food chain: 46 37 45 52 56 26 25 47 55 29 40 31 50 33…
A: From the above data We are given that the Consider the ages of 18 employees in a fast-food chain: 46…
Q: Derive the formulas for the variance of the MLE estimators of the unknown parameters of the simple…
A: Solution: It is needed to derive the formulas for the variance of the MLE estimators of the simple…
Q: A stratified sample of 100 pupils is to be taken, related to how they travel to school. How many…
A: here given , school has 600 pupils here for stratified sampling no of sample form each category =…
Q: Below are the scores of 20 students in a 50-item statistics quiz: 35 42 25 29 38 39 49 41 28 26 26…
A: Given information: No. of…
Q: r 2 Emotion: Neutral vs. Smiling the experiment is summarized below. No. Attractive Unattractive…
A: *Answer:
Q: many books would I need to select from each category for a 5% stratified sample? 5% of. ......…
A: Twelve boxes of books are delivered to a school. Altogether there are 400 books delivered. From…
pls help! rate will be given! Write the solutions legibly!
ENGINEERING DATA ANALYSIS
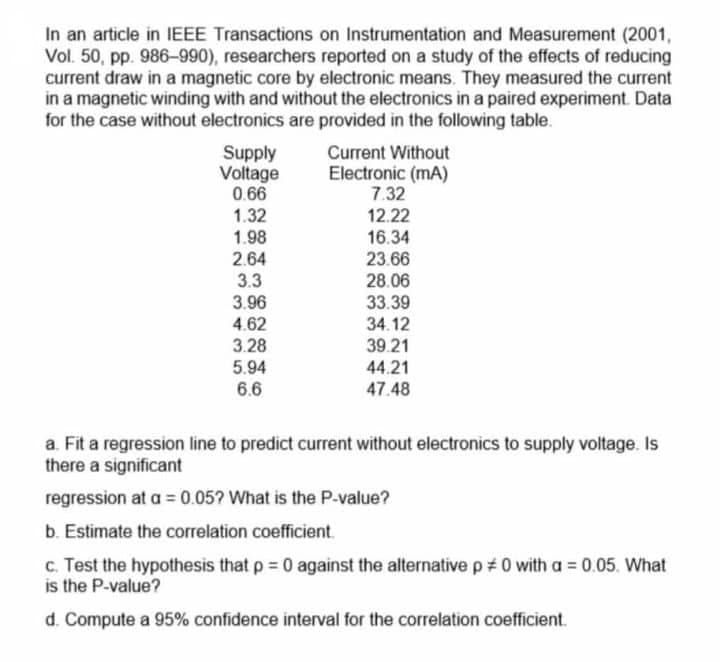
Step by step
Solved in 2 steps with 2 images
- Repeat Example 5 when microphone A receives the sound 4 seconds before microphone B.An article in the Journal of Applied Polymer Science (Vol. 56, pp. 471–476, 1995) studied the effect of the mole ratio of sebacic acid on the intrinsic viscosity of copolyesters.- The data follows: Viscosity 0.45 0.2 0.34 0.58 0.7 0.57 0.55 0.44 Mole ratio 1 0.9 0.8 0.7 0.6 0.5 0.4 0.3 (a) Construct a scatter diagram of the data.An article in the ASCE Journal of Energy Engineering [“Overview of Reservoir Release Improvements at 20 TVA Dams” (Vol. 125, April 1999, pp. 1–17)] presents data on dissolved oxygen concentrations in streams below 20 dams in the Tennessee Valley Authority system. The observations are (in milligrams per liter):
- Researchers interested in lead exposure due to car exhaust sampled the blood of 52 police officers subjected to constant inhalation of automobile exhaust fumes while working traffic enforcement in a primarily urban environment. The blood samples of these officers had an average lead concentration of 124.32 µg/l and a SD of 37.74 µg/l; a previous study of individuals from a nearby suburb, with no history of exposure, found an average blood level concentration of 35 µg/l. Test the hypothesis that the downtown police officers have a higher lead exposure than the group in the previous study. Interpret your results in context. Based on your preceding result, without performing a calculation, would a 99% confidence interval for the average blood concentration level of police officers contain 35 µg/l? Based on your preceding result, without performing a calculation, would a 99% confidence interval for this difference contain 0? Explain why or why not.The article “Withdrawal Strength of Threaded Nails” (D. Rammer, S. Winistorfer, and D. Bender, Journal of Structural Engineering 2001:442–449) describes an experiment comparing the ultimate withdrawal strengths (in N/mm) for several types of nails. For an annularly threaded nail with shank diameter 3.76 mm driven into spruce-pine-fir lumber, the ultimate withdrawal strength was modeled as lognormal with μ = 3.82 and σ = 0.219. For a helically threaded nail under the same conditions, the strength was modeled as lognormal with μ = 3.47 and σ = 0.272. a) What is the mean withdrawal strength for annularly threaded nails? b) What is the mean withdrawal strength for helically threaded nails? c) For which type of nail is it more probable that the withdrawal strength will be greater than 50 N/mm? d) What is the probability that a helically threaded nail will have a greater withdrawal strength than the median for annularly threaded nails? e) An experiment is performed in which withdrawal…The article in the ASCE Journal of Energy Engineering (1999, Vol. 125, pp.59-75) describes a study of the thermal inertia properties of autoclaved aerated concrete used as a building material. Five samples of the material were tested in a structure, and the average interior temperatures (°C) reported were as follows: 23.01, 22.22, 22.04, 22.62, and 22.59. Test that the average interior temperature is equal to 22.5°C using alpha (a) = 0.05. This problem is a test on what population parameter? What is the null and alternative hypothesis? What are the Significance level and type of test? What standardized test statistic will be used? What is the standard test statistic? What is the Statistical Decision? What is the statistical decision in the statement form?
- The aging Neotropical termites (Neocapritermes taracua) secrete a sticky, blue-colored liquid that they spew to intruding termites. The younger Neotropical termites secrete a liquid that lacks the blue component, so it is white in appearance. In an experiment that measured the toxicity of the blue substance, the researchers placed one drop of either the blue liquid or the white liquid on individuals of a second termite species, Labiotermes labralis. Of the 41 Labiotermes labralis that got the blue drop, 37 were immobilized. Of the 40 Labiotermes labralis that got the white drop, 9 were immobilized. Is the blue liquid toxic compared to the white liquid?A deficiency of the trace element selenium in the diet can negatively impact growth, immunity, muscle and neuromuscular function, and fertility. The introduction of selenium supplements to dairy cows is justified when pastures have low selenium levels. Authors of the article “Effects of Short-Term Supplementation with Selenised Yeast on Milk Production and Composition of Lactating Cows” (Australian J. of Dairy Tech., 2004: 199–203) supplied the following data on milk selenium concentration (mg/L) for a sample of cows given a selenium supplement and a control sample given no supplement, both initially and after a 9-day period. Obs Init Se Init Cont Final Se Final Cont 1 11.4 9.1 138.3 9.3 2 9.6 8.7 104 8.8 3 10.1 9.7 96.4 8.8 4 8.5 10.8 89 10.1 5 10.3 10.9 88 9.6 6 10.6 10.6 103.8 8.6 7 11.8 10.1 147.3 10.4 8 9.8 12.3 97.1 12.4 9 10.9 8.8 172.6 9.3 10 10.3…An article in Technometrics (1974, Vol. 16, pp. 523–531) considered the following stack-loss data from a plant oxidizing ammonia to nitric acid. Twenty-one daily responses of stack loss (the amount of ammonia escaping) were measured with air flow x1, temperature x2, and acid concentration x3. y = 42, 37, 37, 28, 18, 18, 19, 20, 15, 14, 14, 13, 11, 12, 8, 7, 8, 8, 9, 15, 15 x1 = 80, 80, 75, 62, 62, 62, 62, 62, 58, 58, 58, 58, 58, 58, 50, 50, 50, 50, 50, 56, 70 x2 = 27, 27, 25, 24, 22, 23, 24, 24, 23, 18, 18, 17, 18, 19, 18, 18, 19, 19, 20, 20, 20 x3 = 89, 88, 90, 87, 87, 87, 93, 93, 87, 80, 89, 88, 82, 93, 89, 86, 72, 79, 80, 82, 91 (a) Fit a linear regression model relating the results of the stack loss to the three regressor variables. (b) Estimate σ2. (c) Find the standard error se(βj). (d) Use the model in part (a) to predict stack loss when x1 = 60, x2 = 26, and x3 = 85.
- Researchers interested in lead exposure due to car exhaust sampled the blood of 52 police officers subjected to constant inhalation of automobile exhaust fumes while working traffic enforcement in a primarily urban environment. The blood samples of these officers had an average lead concentration of 124.32 µg/l and a SD of 37.74 µg/l; a previous study of individuals from a nearby suburb, with no history of exposure, found an average blood level concentration of 35 µg/l. Based on your preceding result, without performing a calculation, would a 99% confidence interval for the average blood concentration level of police officers contain 35 µg/l? Based on your preceding result, without performing a calculation, would a 99% confidence interval for this difference contain 0? Explain why or why not.Consider the following 10 measurements about the cohesion of a soil: 12 kPa, 14 kPa, 15 kPa, 14.5 kPa, 16.0 kPa, 18 kPa, 15 kPa, 16.2 kPa, 17. 6 kPa, 13 kPa. Work out the solutions of the following two problems, assuming the cohesion follows the normal and lognormal distributions, respectively. (1) Draw the PDF of the cohesion; (2) Evaluate the probability that the cohesion based on the PDF is less than 5 kPa, 10 kPa, and 15 kPa; (3) Assess the effect of the type of distribution on the results.The following partial JMP regression output for the Fresh detergent data relates to predicting demand for future sales periods in which the price difference will be .10. SE Fit = .165360573, s = .628152. Predicted Demand Lower 95% MeanDemand Upper 95% MeanDemand 31 8.181072245 7.842346262 8.519798229 StdErr IndivDemand Lower 95% IndivDemand Upper 95% MeanDemand 0.649552965 6.850522511 9.511621980 Click here for the Excel Data File (a) Report a point estimate of and a 95 percent confidence interval for the mean demand for Fresh in all sales periods when the price difference is .10. (Round your CI answers to 3 decimal places and other answer to 4 decimal places.) (b) Report a point prediction of and a 95 percent prediction interval for the actual demand for Fresh in an individual sales period when the price difference is .10. (Round your PI answers to 3 decimal places and other answer to 4 decimal places.) (c) StdErr Indiv Demand on…