.Use Google Sheets (or Microsoft Excel, Apple Numbers, LibreOffice, etc) on your computer/tablet to create a Bar Graph using the following data: CO2 Emissions Ukraine 2003 352,259 2004 343,121 2005 339,029 2006 327,797 2007 328,357 2008 323,657 2009 272,176
.Use Google Sheets (or Microsoft Excel, Apple Numbers, LibreOffice, etc) on your computer/tablet to create a Bar Graph using the following data: CO2 Emissions Ukraine 2003 352,259 2004 343,121 2005 339,029 2006 327,797 2007 328,357 2008 323,657 2009 272,176

Holt Mcdougal Larson Pre-algebra: Student Edition 2012
1st Edition
ISBN:9780547587776
Author:HOLT MCDOUGAL
Publisher:HOLT MCDOUGAL
ChapterCSR: Contents Of Student Resources
Section: Chapter Questions
Problem 13.5P

Related questions
Question
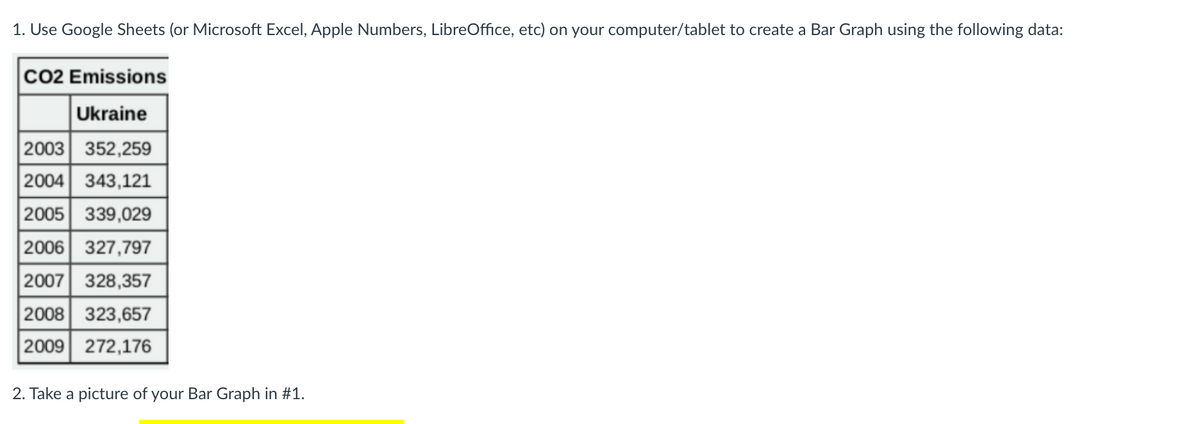
Transcribed Image Text:1. Use Google Sheets (or Microsoft Excel, Apple Numbers, LibreOffice, etc) on your computer/tablet to create a Bar Graph using the following data:
CO2 Emissions
Ukraine
2003 352,259
2004 343,121
2005 339,029
2006 327,797
2007 328,357
2008 323,657
2009 272,176
2. Take a picture of your Bar Graph in #1.
Expert Solution
This question has been solved!
Explore an expertly crafted, step-by-step solution for a thorough understanding of key concepts.

This is a popular solution!

Trending now
This is a popular solution!

Step by step
Solved in 2 steps with 1 images

Recommended textbooks for you
Holt Mcdougal Larson Pre-algebra: Student Edition…
Algebra
ISBN:
9780547587776
Author:
HOLT MCDOUGAL
Publisher:
HOLT MCDOUGAL

Glencoe Algebra 1, Student Edition, 9780079039897…
Algebra
ISBN:
9780079039897
Author:
Carter
Publisher:
McGraw Hill
Holt Mcdougal Larson Pre-algebra: Student Edition…
Algebra
ISBN:
9780547587776
Author:
HOLT MCDOUGAL
Publisher:
HOLT MCDOUGAL
Glencoe Algebra 1, Student Edition, 9780079039897…
Algebra
ISBN:
9780079039897
Author:
Carter
Publisher:
McGraw Hill