During the exam you will be using a sample of 500 adults with the following variables: ● genhelf-variable recording general self-reported health coded 1 = very good, 2 = good, 3 = fair, 4 = poor ● sbp-variable recording systolic blood pressure •age - age of the respondent in years sex-coded 1 = male and 2 = female • hi_sbp - indicator of high blood pressure coded 1 if the respondent's sbp is 130 or higher and 0 otherwise What type of chart is MOST appropriate for showing the relationship between the variables sbp and age? O scatterplot O clustered bar chart O box and whisker plot (by categories) multiple pie charts
During the exam you will be using a sample of 500 adults with the following variables: ● genhelf-variable recording general self-reported health coded 1 = very good, 2 = good, 3 = fair, 4 = poor ● sbp-variable recording systolic blood pressure •age - age of the respondent in years sex-coded 1 = male and 2 = female • hi_sbp - indicator of high blood pressure coded 1 if the respondent's sbp is 130 or higher and 0 otherwise What type of chart is MOST appropriate for showing the relationship between the variables sbp and age? O scatterplot O clustered bar chart O box and whisker plot (by categories) multiple pie charts

Big Ideas Math A Bridge To Success Algebra 1: Student Edition 2015
1st Edition
ISBN:9781680331141
Author:HOUGHTON MIFFLIN HARCOURT
Publisher:HOUGHTON MIFFLIN HARCOURT
Chapter4: Writing Linear Equations
Section: Chapter Questions
Problem 14CR

Related questions
Question
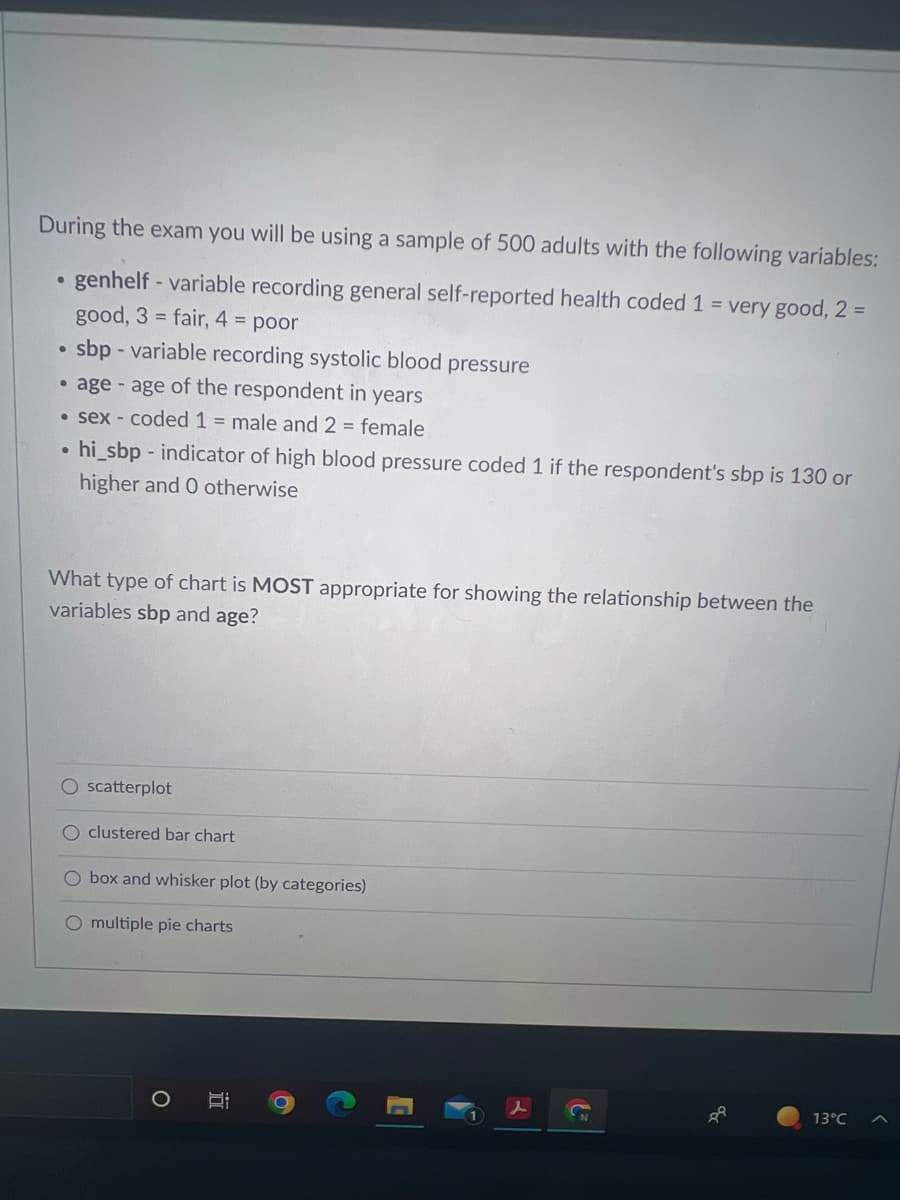
Transcribed Image Text:During the exam you will be using a sample of 500 adults with the following variables:
●
genhelf - variable recording general self-reported health coded 1 = very good, 2 =
good, 3 = fair, 4 = poor
●
sbp - variable recording systolic blood pressure
•age - age of the respondent in years
• sex - coded 1 = male and 2 = female
●
hi_sbp-indicator of high blood pressure coded 1 if the respondent's sbp is 130 or
higher and 0 otherwise
What type of chart is MOST appropriate for showing the relationship between the
variables sbp and age?
O scatterplot
O clustered bar chart
O box and whisker plot (by categories)
O multiple pie charts
13°C
Ca
Expert Solution
This question has been solved!
Explore an expertly crafted, step-by-step solution for a thorough understanding of key concepts.

Step by step
Solved in 2 steps

Recommended textbooks for you
Big Ideas Math A Bridge To Success Algebra 1: Stu…
Algebra
ISBN:
9781680331141
Author:
HOUGHTON MIFFLIN HARCOURT
Publisher:
Houghton Mifflin Harcourt
Big Ideas Math A Bridge To Success Algebra 1: Stu…
Algebra
ISBN:
9781680331141
Author:
HOUGHTON MIFFLIN HARCOURT
Publisher:
Houghton Mifflin Harcourt