Statistical Analysis - Data Management Per each graph, answer the following: Any relevant statistics to support your findings (mean, median, mode, standard deviation, etc.) Include the equation for the line/curve of best fit. You can analyze different models: linear, quadratic, exponential, polynomial, etc. Explain the r2 and r value (if needed) see your notes from the appropriate section. How these stats characterize relationships between variables? Sampling techniques involved in a data collection. Population? Bias and extraneous variables. Final statement (future trends, what you expect to happen)
Statistical Analysis - Data Management Per each graph, answer the following: Any relevant statistics to support your findings (mean, median, mode, standard deviation, etc.) Include the equation for the line/curve of best fit. You can analyze different models: linear, quadratic, exponential, polynomial, etc. Explain the r2 and r value (if needed) see your notes from the appropriate section. How these stats characterize relationships between variables? Sampling techniques involved in a data collection. Population? Bias and extraneous variables. Final statement (future trends, what you expect to happen)

College Algebra
7th Edition
ISBN:9781305115545
Author:James Stewart, Lothar Redlin, Saleem Watson
Publisher:James Stewart, Lothar Redlin, Saleem Watson
Chapter9: Counting And Probability
Section: Chapter Questions
Problem 7T: An anagram of a word is a rearrangement of the letters of the word. (a) How many anagrams of the...

Related questions
Question
Statistical Analysis - Data Management
Per each graph, answer the following:
- Any relevant statistics to support your findings (mean, median,
mode , standard deviation, etc.) - Include the equation for the line/curve of best fit. You can analyze different models: linear, quadratic, exponential, polynomial, etc.
- Explain the r2 and r value (if needed) see your notes from the appropriate section. How these stats characterize relationships between variables?
- Sampling techniques involved in a data collection. Population?
- Bias and extraneous variables.
- Final statement (future trends, what you expect to happen)
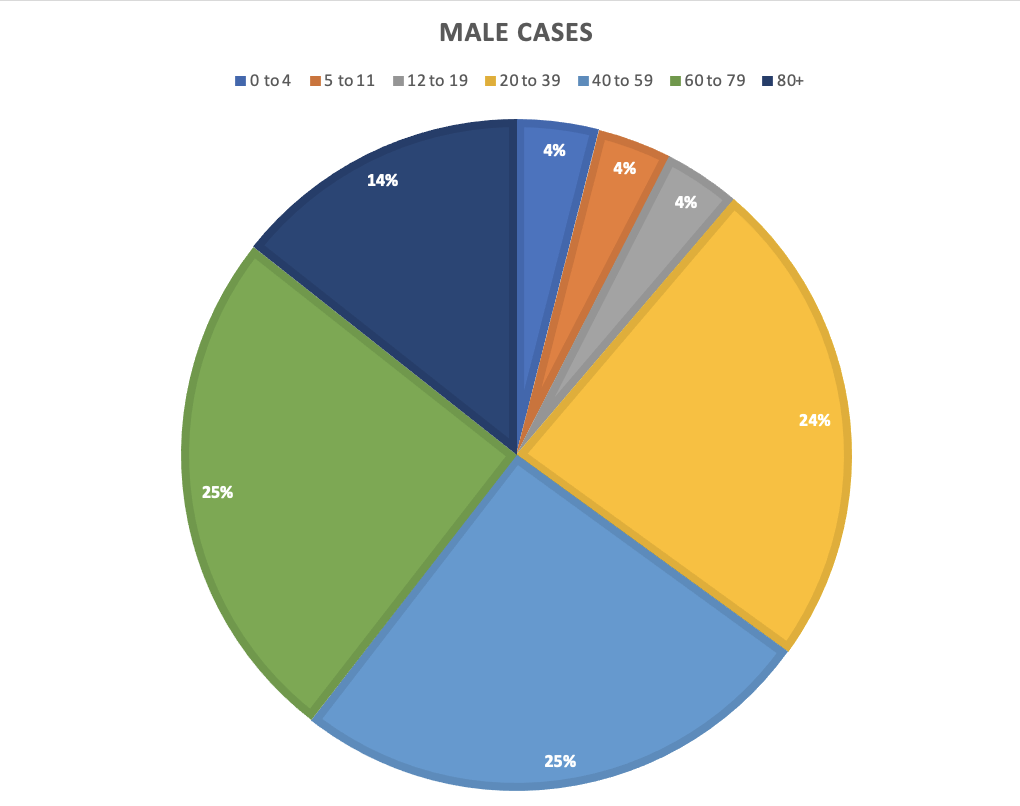
Transcribed Image Text:25%
MALE CASES
■0 to 4 ■5 to 1112 to 1920 to 39 40 to 59 60 to 79 80+
4%
4%
14%
25%
4%
24%
Expert Solution
This question has been solved!
Explore an expertly crafted, step-by-step solution for a thorough understanding of key concepts.

Step by step
Solved in 2 steps with 2 images

Recommended textbooks for you
College Algebra
Algebra
ISBN:
9781305115545
Author:
James Stewart, Lothar Redlin, Saleem Watson
Publisher:
Cengage Learning

Glencoe Algebra 1, Student Edition, 9780079039897…
Algebra
ISBN:
9780079039897
Author:
Carter
Publisher:
McGraw Hill

Algebra: Structure And Method, Book 1
Algebra
ISBN:
9780395977224
Author:
Richard G. Brown, Mary P. Dolciani, Robert H. Sorgenfrey, William L. Cole
Publisher:
McDougal Littell
College Algebra
Algebra
ISBN:
9781305115545
Author:
James Stewart, Lothar Redlin, Saleem Watson
Publisher:
Cengage Learning
Glencoe Algebra 1, Student Edition, 9780079039897…
Algebra
ISBN:
9780079039897
Author:
Carter
Publisher:
McGraw Hill
Algebra: Structure And Method, Book 1
Algebra
ISBN:
9780395977224
Author:
Richard G. Brown, Mary P. Dolciani, Robert H. Sorgenfrey, William L. Cole
Publisher:
McDougal Littell

Algebra & Trigonometry with Analytic Geometry
Algebra
ISBN:
9781133382119
Author:
Swokowski
Publisher:
Cengage

Algebra and Trigonometry (MindTap Course List)
Algebra
ISBN:
9781305071742
Author:
James Stewart, Lothar Redlin, Saleem Watson
Publisher:
Cengage Learning