During the first 13 weeks of the television season, the Saturday evening 8:00 P.M. to 9:00 P.M. audience proportions were recorded as ABC 30%, CBS 27%, NBC 23%, and Independents 20%. A sample of 300 homes two weeks after a Saturday night schedule revision yielded the following viewing audience data: ABC 95 homes, CBS 65 homes, NBC 83 homes, and Independents 57 homes. Test with a = 0.05 to determine whether the viewing audience proportions changed. Find the test statistic and p-value. (Round your test statistic to two decimal places. Use Table 3 of Appendix B.) Test statistic = p-value is - Select your answer - Conclusion: There is Select your answer v change in the viewing audience proportions.
During the first 13 weeks of the television season, the Saturday evening 8:00 P.M. to 9:00 P.M. audience proportions were recorded as ABC 30%, CBS 27%, NBC 23%, and Independents 20%. A sample of 300 homes two weeks after a Saturday night schedule revision yielded the following viewing audience data: ABC 95 homes, CBS 65 homes, NBC 83 homes, and Independents 57 homes. Test with a = 0.05 to determine whether the viewing audience proportions changed. Find the test statistic and p-value. (Round your test statistic to two decimal places. Use Table 3 of Appendix B.) Test statistic = p-value is - Select your answer - Conclusion: There is Select your answer v change in the viewing audience proportions.

Holt Mcdougal Larson Pre-algebra: Student Edition 2012
1st Edition
ISBN:9780547587776
Author:HOLT MCDOUGAL
Publisher:HOLT MCDOUGAL
Chapter11: Data Analysis And Probability
Section11.5: Interpreting Data
Problem 1C

Related questions
Question
During the first 13 weeks of the television season, the Saturday evening 8:00 p.m. to 9:00 ... p.m. audience proportions were recorded as ABC 30%, CBS 27%, NBC 23%, and independents 20% ... Test with a = .05 to determine whether the viewing audience proportions changed
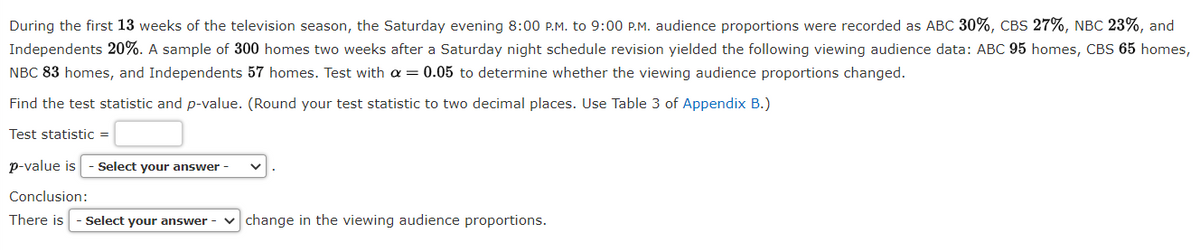
Transcribed Image Text:During the first 13 weeks of the television season, the Saturday evening 8:00 P.M. to 9:00 P.M. audience proportions were recorded as ABC 30%, CBS 27%, NBC 23%, and
Independents 20%. A sample of 300 homes two weeks after a Saturday night schedule revision yielded the following viewing audience data: ABC 95 homes, CBS 65 homes,
NBC 83 homes, and Independents 57 homes. Test with a = 0.05 to determine whether the viewing audience proportions changed.
Find the test statistic and p-value. (Round your test statistic to two decimal places. Use Table 3 of Appendix B.)
Test statistic =
p-value is
Select your answer -
Conclusion:
There is
Select your answer -
v change in the viewing audience proportions.
Expert Solution
This question has been solved!
Explore an expertly crafted, step-by-step solution for a thorough understanding of key concepts.

This is a popular solution!

Trending now
This is a popular solution!

Step by step
Solved in 3 steps with 3 images

Recommended textbooks for you
Holt Mcdougal Larson Pre-algebra: Student Edition…
Algebra
ISBN:
9780547587776
Author:
HOLT MCDOUGAL
Publisher:
HOLT MCDOUGAL

Glencoe Algebra 1, Student Edition, 9780079039897…
Algebra
ISBN:
9780079039897
Author:
Carter
Publisher:
McGraw Hill
Holt Mcdougal Larson Pre-algebra: Student Edition…
Algebra
ISBN:
9780547587776
Author:
HOLT MCDOUGAL
Publisher:
HOLT MCDOUGAL
Glencoe Algebra 1, Student Edition, 9780079039897…
Algebra
ISBN:
9780079039897
Author:
Carter
Publisher:
McGraw Hill