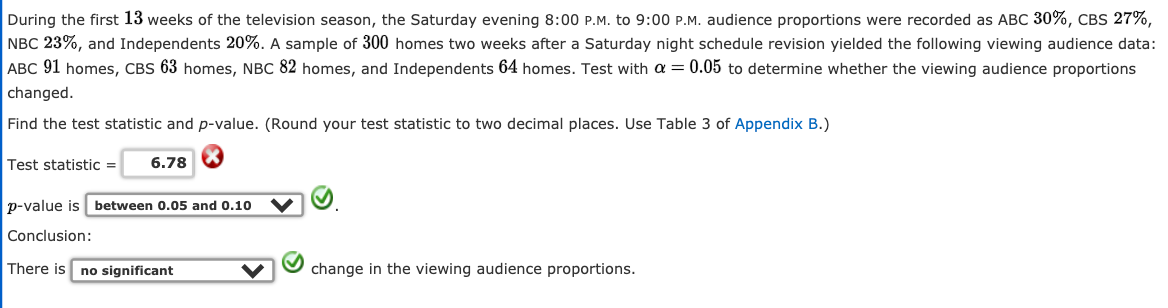
During the first 13 weeks of the television season, the Saturday evening 8:00 P.M. to 9:00 P.M. audience proportions were recorded as ABC 30%, CBS 27%, NBC 23%, and Independents 20%. A sample of 300 homes two weeks after a Saturday night schedule revision yielded the following viewing audience data: ABC 91 homes, CBS 63 homes, NBC 82 homes, and Independents 64 homes. Test with a = 0.05 to determine whether the viewing audience proportions changed. Find the test statistic and p-value. (Round your test statistic to two decimal places. Use Table 3 of Appendix B.) Test statistic = 6.78 8 p-value is between 0.05 and 0.10 Conclusion: There is no significant change in the viewing audience proportions.


Angles in Circles
Angles within a circle are feasible to create with the help of different properties of the circle such as radii, tangents, and chords. The radius is the distance from the center of the circle to the circumference of the circle. A tangent is a line made perpendicular to the radius through its endpoint placed on the circle as well as the line drawn at right angles to a tangent across the point of contact when the circle passes through the center of the circle. The chord is a line segment with its endpoints on the circle. A secant line or secant is the infinite extension of the chord.
Arcs in Circles
A circular arc is the arc of a circle formed by two distinct points. It is a section or segment of the circumference of a circle. A straight line passing through the center connecting the two distinct ends of the arc is termed a semi-circular arc.
R3


Trending now
This is a popular solution!

Step by step
Solved in 2 steps with 1 images


