Dynamic viscosity of water μ (10-³ N.) is related to temperature TCC) in the following manner: (let T = x; μ = y) T н O 5 1.787 1.519 10 1.307 20 30 40 1.002 0.7975 0.6529 a. Derive linear regression equation to fit a line to these data. Using the linear equation make prediction at T = 7.5°C b. Derive second order regression equation to fit a parabola to these data. Using the parabolic equation mak prediction at T = 7.5°C
Q: Central topic Markov chains: People who work in the center of a growing city and do not live in the…
A:
Q: Let be a random variable that possesses a binomial distribution with p= 0.6 and n=13. Using the…
A: Number of trials n=13 Probability of success p=0.6 X~binomial(n,p)
Q: Finish times (to the nearest hour) for 57 dogsled teams are shown below. Use Categorize the basic…
A: The shape of a Distribution The volume of summits in dispersion, as well as its symmetry, deviation,…
Q: Let N (t) follow a Poisson process with rate parameter .25. Recall that N(5) follows a Poisson( λ )…
A: Nt follow a Poisson process with a rate parameter of 0.25.
Q: Calculate the standard error. (Round your answers to 4 decimal places.) Standard Error (a) n…
A: (a) n = 27, π = 0.24(b) n = 56, π = 0.43 (c) n = 123, π = 0.47
Q: Find the z-score for a single member of the population which has value 84.9. if the population has a…
A: The population mean is 58.1 and the population standard deviation is 6.06.
Q: Define the process X(t) = eaw (t)- za²t Use this process to answer the following problems. (a) Find…
A: In the given problem, we are introduced to a stochastic process represented by the equation:…
Q: Which of the following will result from running a regression model with a high degree of correlation…
A: Multicollinearity exists when an independent variable is highly correlated with the other…
Q: a delivery company that has a large fleet of delivery truck. The distance a truck travels in a day…
A:
Q: You are in charge of a delivery company that has a large fleet of delivery truck. The distance a…
A:
Q: no prefer this particula next whole number. brand of pain killer is 2 percen
A: The given data is n = 400x = 8599% ci for pE = 0.02n = ?
Q: A researcher wants to know if the mean times (in minutes) that people watch their favorite news…
A: Since you have posted a question with multiple sub-parts, we will solve first three sub- parts for…
Q: The mean height for baby African giraffes is = 68.5 inches, with a standard deviation of = 3…
A: we have given baby giraffes baby zebras mean (xbar) 68.5 62.7 standard deviation (sigma) 3…
Q: A company that makes robotic vacuums claims that their newest model of vacuum lasts, on average, two…
A: From the given information, the claim is to test whether the trrue mean run time for all vacuums of…
Q: Discussion: (1) Describe the number of modes, skewness, and kurtosis as they related to explaining a…
A: The normal distribution is also known as the Gaussian distribution. It follows the condition of the…
Q: Are the means for the final exams different for all statistics class delivery types? The table below…
A: Since you have posted a question with multiple sub-parts, we will solve first three sub- parts for…
Q: Your friend is thinking about buying shares of stock in a company. You have been tracking the…
A: It is required to identify the best graph to represent the data.
Q: In a randomized double-blind, placebo-controlled trial of children, an herb was tested as a…
A: It is assumed that μ1, μ2 are the population mean number of days with fever, for population 1 and 2…
Q: You are a big soccer fan and you decide to gather information on the goal differential (goals scored…
A: The regression equation for goal differential on the dummy variable is given as: G^i=β^0+β^1Di. The…
Q: The mass of a particular fiberglass panel is normally distributed with mean of 66 kg and a standard…
A: Mean=66 kg Standard deviation =5 kg
Q: A high school biology class conducted genetics experiments with randomly selected fruit flies, and…
A: Provided data: Characteristic Red Eye/Normal Wing Sepla Eye/ Noral wing Red Eye/ Vestigial wing…
Q: Suppose you have been hired by a political consulting firm. Your task is to use data to predict…
A: That is, there is no evidence to conclude that the population proportion of votes cast is more than…
Q: A coin is tossed n times. What is the chance that the head will present itself an even number of…
A: A coin is tossed n times.
Q: Listed below are annual data for various years. The data are weights (metric tons) of imported…
A:
Q: The domestic airfare for business travel for the current year and the previous year was reported. A…
A: Let us consider the two samples Here, the two samples are paired since the same flights are used in…
Q: 40 pulse rates of men have a mean of 69.4 beats per minute and a standard deviation of 11.3 beats…
A: The sample size is 40, sample standard deviation is 11.3.
Q: An article suggests that substrate concentration (mg/cm³) of influent to a reactor is normally…
A: Mean=0.30 Standard deviations=0.06
Q: Question The lognormal model for stock prices is given by S(4)= 100e012+0.22, where Z~ N(0, 1).…
A: “Since you have asked multiple questions, we will solve the first question for you. If you want any…
Q: The price per share of stock for a sample of 25 companies was recorded at the beginning of 2012 and…
A: The given data along with the change in price per share of company between the first quarter of 2012…
Q: The number of successes and the sample size for a simple random sample from a population are given…
A: The given information is x=7,n=28,H0:p=0.4,Ha:p<0.4,α=0.10.
Q: An anthropology student proposes to model lifetimes of the human inhabitants of an island using the…
A: The failure rate function proposed by the student is given as: r(t)=K ; t≥0 and 0 ;…
Q: 5) We wish to test of hypothesis b. [ c. I d. [ Ho:μ1=p2 vs H₁ : μ₁ # 12. Use the significance level…
A: Note: As requested by the student, the answer is provided for Q2.5 only. It is given that the…
Q: 4. For two random variables X and Y, if E(X) = 1, E(X²) = 2, E(Y) = 2, E(Y2) 10, E(XY) = 4. What is…
A: According to the information provided in the question, X and Y are two random variables such that ;…
Q: Data set One Results below represent caloric content of different foods 405 580 300 320 720 470 530…
A: Arrange the given data in ascending order 225 , 290, 290, 295, 300, 320, 320, 330, 340, 390, 390,…
Q: According the a 2017 Gallup poll, 80% of Americans report being afflicted by stress. Suppose a…
A: To proceed, it is crucial to grasp the underlying assumptions of the Central Limit Theorem (CLT):…
Q: Let X be a random variable defined on a probability space (N, F, P). Show that the triple (R, B(R),…
A: In probability theory, a probability space is a mathematical construct that formalizes the concept…
Q: The table showing the stock price changes for a sample of 12 companies on a day is contained in the…
A: The data for the price change for 12 companies are given.
Q: An automotive part must be machined to close tolerances to be acceptable to customers. Production…
A: The data set is inserted in excel as follows:
Q: Researchers at Purdue University and Wichita State University found that airlines are doing a better…
A: There are two independent samples which are AirTran and Southwest. We have to test whether there is…
Q: Jocelyn believes that the amount of sleep she tends to get on weekends differs from the amount of…
A: Test statistic t is -3.79 P-value =0.002 and 0.005
Q: Jocelyn believes that the amount of sleep she tends to get on weekends differs from the amount of…
A: School week : { 7,7.5,8,6.5,8,7.5,7,6.5,7,8 } N1 =10 df1 = N-1 = 9 Weekend : {…
Q: Assume that a simple random sample has been selected from a normally distributed population and test…
A: A random sample of 6 observations is given. We have to test whether the sample is from a population…
Q: The boxplots below display annual incomes (in thousands of dollars) of households in two cities. O…
A: The boxplots for two cities are given.
Q: A study shows that running increases the percent resting metabolic rate (RMR) in older women. The…
A:
Q: 1. Suppose that X and Y have a discrete joint distribution function as follows: f(x, y) = = xy 36 0…
A: Let X and Y have a joint pmf
Q: 4. A college wants to investigate whether students perform better on mornings that they have had a…
A: Sample size, n=100 Sample mean of difference, d¯=4.5 Sample sd of difference, sd=3.6 CL=0.95
Q: Consumer Reports uses a 100-point customer satisfaction score to rate the nation's major chain…
A:
Q: Use technology to find the P-value for the hypothesis test described below. The claim is that for a…
A: Q.9F Answer:- Given, Sample size , n=12 Mean , μ = 11 Test statistic, t = -2.497 Using…
Q: Find the indicated z score. The graph depicts the standard normal distribution with mean 0 and…
A: The information provided in the question are as follows :- The standard normal distribution with…
Q: Assume that females have pulse rates that are normally distributed with a mean of μ = 72.0 beats per…
A: The question is about normal dist. Given : Popl. mean pulse rate of females ( μ ) = 72 beats per…
Please solve and maintain 4 decimal places.
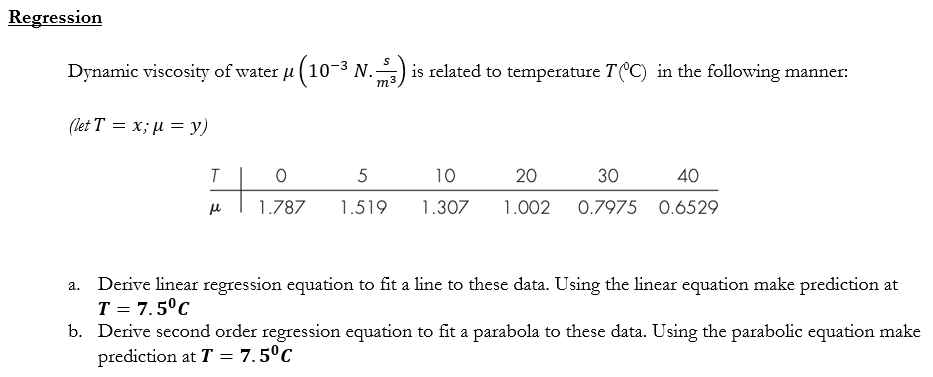
Step by step
Solved in 3 steps with 2 images
- XYZ Corporation Stock Prices The following table shows the average stock price, in dollars, of XYZ Corporation in the given month. Month Stock price January 2011 43.71 February 2011 44.22 March 2011 44.44 April 2011 45.17 May 2011 45.97 a. Find the equation of the regression line. Round the regression coefficients to three decimal places. b. Plot the data points and the regression line. c. Explain in practical terms the meaning of the slope of the regression line. d. Based on the trend of the regression line, what do you predict the stock price to be in January 2012? January 2013?Zipfs Law The following table shows U.S cities by rank in terms of population and population in thousands. City Rank r Population N New York 1 8491 Chicago 3 2722 Philadelphia 5 1560 Dallas 9 1280 Austin 11 913 San Francisco 13 852 Columbus 15 836 A rule known as Zipfs law tells us that it is reasonable to approximate these data with a power function. a Use power regression to express the population as a function of the rank. b Plot the data along with the power function from part a. c Phoenix is the sixth largest city in the United States. Use your answer from part a to estimate population of Phoenix. Round your answer in thousands to the nearest whole number. Note: The actual population is 1537 thousand.Let x be the size of a house (in square feet) and y be the amount of natural gas used (therms) during a specified period. Suppose that for a particular community, x and y are related according to the simple linear regression model with the following values. ? = slope of population regression line = 0.016 ? = y intercept of population regression line = −7 Question: Graph the population regression line by first finding the point on the line corresponding to x = 1,000 and then the point corresponding to x = 2,000, and drawing a line through these points.
- The estimated regression equation for a model involving two independent variables and 10 observations follows. y^=31.5111+0.5611x1+0.3254x2 a. Interpret b1b and b2 in this estimated regression equation (to 4 decimals ) b1____ b2____ b. Estimate y when x1=180 and x2=310 ( to 3 decimals)The measure of standard error can also be applied to the parameter estimates resulting from linear regressions. For example, consider the following linear regression equation that describes the relationship between education and wage: WAGEi=β0+β1EDUCi+εi where WAGEi is the hourly wage of person i (i.e., any specific person) and EDUCi is the number of years of education for that same person. The residual εi encompasses other factors that influence wage, and is assumed to be uncorrelated with education and have a mean of zero. Suppose that after collecting a cross-sectional data set, you run an OLS regression to obtain the following parameter estimates: WAGEi=−11.5+6.1 EDUCi If the standard error of the estimate of β1 is 1.32, then the true value of β1 lies between(4.78, 4.12, 3.46, 5.44) and (6.76, 7.42, 8.74) . As the number of observations in a data set grows, you would expect this range to (DECREASE , INCREASE) in size.A paddle wheel on a boat has a diameter of 5 meters and takes180 seconds to complete one revolution. As the wheel begins to turn, a barnacle attaches to the wheel at its lowest point, which is 0.5 meters below the surface of the water. a) Create a table of values that describes the height of the barnacle on the outer edge of the wheel during the first 12 minutes of the boat ride. b) Use your table of values to write a sinusoidal regression equation that models the height of the barnacle as a function of time. (Round to the nearest tenth). c) How does the radius of the paddle wheel relate to the parameters of your equation? Explain d) The barnacle falls off the wheel after 22.5 minutes. Use your regression equation to predict the height of the barnacle when it falls of the wheel, to the nearest tenth of a meter. e) Determine the total time within the first rotation that the barnacle is at least 2 meters above the surface of the water, rounded to the nearest tenth of a minute
- Life expectancy at birth is the estimated lifespan of a baby born in a particular year given the conditions of that time period. The regression line is y=0.205x-336, where x=birth year and y=US life male expectancy in years. The value of r2 is 0.981 a. use the regression line to estimate the US life expetancy of a male baby born in 1990, to the nearest tenth of a year. b. use the regression line to predict the US life expectancy of a male baby born in 2014, to the nearest tenth of a year. c. what is the slope regression line and what are the units of measurement?The least-squares regression equation is y=620.6x+16,624 where y is the median income and x is the percentage of 25 years and older with at least a bachelor's degree in the region. The scatter diagram indicates a linear relation between the two variables with a correlation coefficient of 0.7004. Interpret the slope.In regards to "Go to Stat > Regression > Regression > Fit a regression model." where is stat?
- Let X = height of the students in inches Let Y = Foot length of the students in centimeters Complete manual solutions for the SLRM coefficients, their interpretations and write down the best fitting linear regression equation. What is the predicted value of foot when height = 75?The estimate of b in the regression equation y=a+bx+error by the method of least square isThe least-squares regression equation is y=728.0x+14,705 where y is the median income and x is the percentage of 25 years and older with at least a bachelor's degree in the region. The scatter diagram indicates a linear relation between the two variables with a correlation coefficient of 0.8165. For every dollar increase in median income, the percent of adults having at least a bachelor's degree is ___%, on average. For a median income of $0, the percent of adults with a bachelor's degree is ____%.