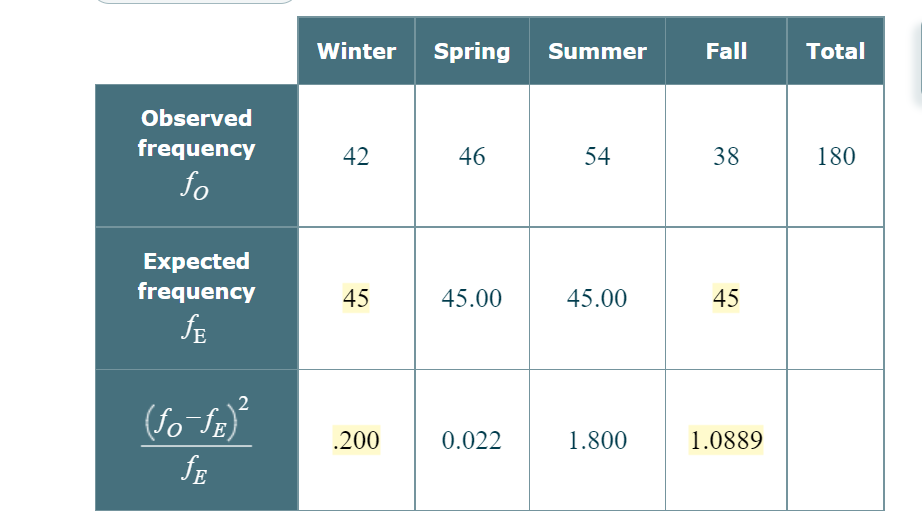
e first row of the table are the frequencies observed in the sample for these season categories. The numbers in the second row are the expected frequencies under the assumption that birthdays are equally likely during each season of the year. The bottom row of numbers gives the following value for each of the season categories. (Each expert I have asked has gotten the critic


Are birthdays "evenly distributed" throughout the year, or are they more common during some parts of the year than others? Owners of a children's toy store chain asked this question. Some data collected by the chain are summarized in the table below. The data were obtained from a random sample of 180 people. The birthdate of each person was recorded, and each of these dates was placed into one of four categories: winter (December 21-March 20), spring (March 21-June 20), summer (June 21-September 20), and fall (September 21-December 20). The numbers in the first row of the table are the frequencies observed in the sample for these season categories. The numbers in the second row are the expected frequencies under the assumption that birthdays are equally likely during each season of the year. The bottom row of numbers gives the following value for each of the season categories.
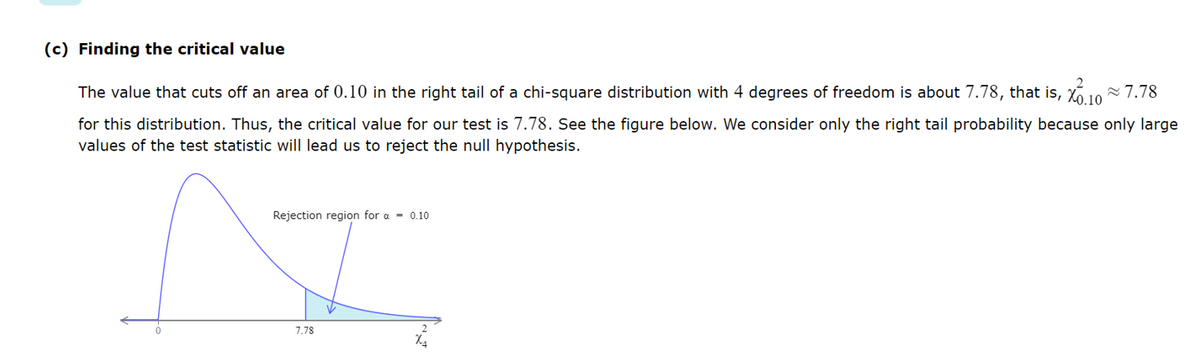
(Each expert I have asked has gotten the critical value wrong so I added a picture of the correct formula to use.)
A. Find the value of the test statistic. (Round your answer to two or more decimal places.)
B. Find the critical value. (Round your answer to two or more decimal places.)
C. Can we reject the hypothesis that birthdays are equally likely during each season of the year?

Step by step
Solved in 2 steps

