e) Make a graph with the CFT, CVT and CT. On the back it describes what the graphed curves mean f) Make another graph, but now with the CFME, CVME, Cme and CMg. Then describe the variation in the graphed curves.
e) Make a graph with the CFT, CVT and CT. On the back it describes what the graphed curves mean f) Make another graph, but now with the CFME, CVME, Cme and CMg. Then describe the variation in the graphed curves.

Managerial Economics: A Problem Solving Approach
5th Edition
ISBN:9781337106665
Author:Luke M. Froeb, Brian T. McCann, Michael R. Ward, Mike Shor
Publisher:Luke M. Froeb, Brian T. McCann, Michael R. Ward, Mike Shor
Chapter4: Extent (how Much) Decisions
Section: Chapter Questions
Problem 3MC

Related questions

Question
100%
Solve part e and f please
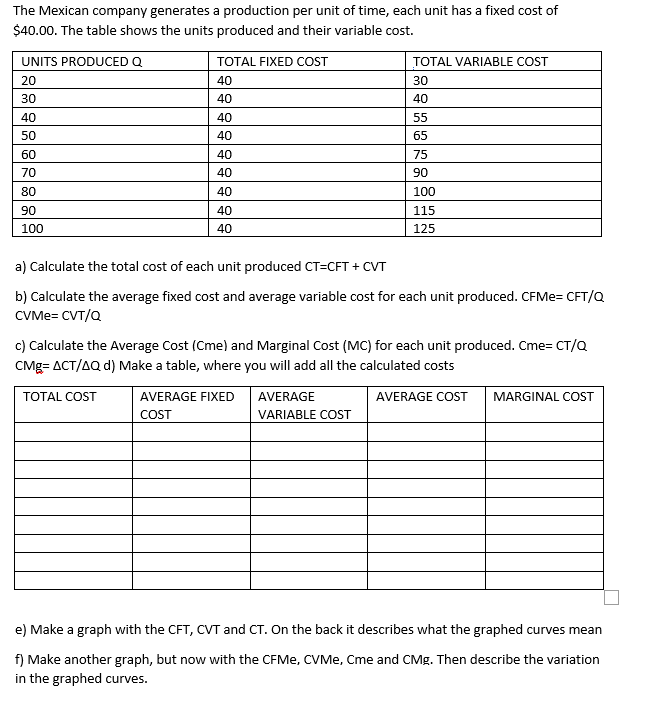
Transcribed Image Text:The Mexican company generates a production per unit of time, each unit has a fixed cost of
$40.00. The table shows the units produced and their variable cost.
UNITS PRODUCED Q
TOTAL FIXED COST
TOTAL VARIABLE COST
20
40
30
30
40
40
40
40
55
50
40
65
60
40
75
70
40
90
80
40
100
90
40
115
100
40
125
a) Calculate the total cost of each unit produced CT=CFT + CVT
b) Calculate the average fixed cost and average variable cost for each unit produced. CFME= CFT/Q
CVME= CVT/Q
c) Calculate the Average Cost (Cme) and Marginal Cost (MC) for each unit produced. Cme= CT/Q
CMg= ACT/AQ d) Make a table, where you will add all the calculated costs
TOTAL COST
AVERAGE FIXED
AVERAGE
AVERAGE COST
MARGINAL COST
COST
VARIABLE COST
e) Make a graph with the CFT, CVT and CT. On the back it describes what the graphed curves mean
f) Make another graph, but now with the CFMe, CVME, Cme and CMg. Then describe the variation
in the graphed curves.
Expert Solution
This question has been solved!
Explore an expertly crafted, step-by-step solution for a thorough understanding of key concepts.

Step by step
Solved in 2 steps with 2 images

Knowledge Booster


Learn more about
Need a deep-dive on the concept behind this application? Look no further. Learn more about this topic, economics and related others by exploring similar questions and additional content below.Recommended textbooks for you
Managerial Economics: A Problem Solving Approach
Economics
ISBN:
9781337106665
Author:
Luke M. Froeb, Brian T. McCann, Michael R. Ward, Mike Shor
Publisher:
Cengage Learning

Managerial Economics: Applications, Strategies an…
Economics
ISBN:
9781305506381
Author:
James R. McGuigan, R. Charles Moyer, Frederick H.deB. Harris
Publisher:
Cengage Learning

Managerial Economics: A Problem Solving Approach
Economics
ISBN:
9781337106665
Author:
Luke M. Froeb, Brian T. McCann, Michael R. Ward, Mike Shor
Publisher:
Cengage Learning
Managerial Economics: Applications, Strategies an…
Economics
ISBN:
9781305506381
Author:
James R. McGuigan, R. Charles Moyer, Frederick H.deB. Harris
Publisher:
Cengage Learning


Principles of Economics 2e
Economics
ISBN:
9781947172364
Author:
Steven A. Greenlaw; David Shapiro
Publisher:
OpenStax