e times (in seconds) between fifteen consecutive eruptions of a geyser were as follows: 914, 900, 883, 919, 940, 949, 933, 880, 918, 928, 855, 899, 926, 883, 907 By entering the data into R, find the following (giving answers to two decimal places): The sample mean is The sample variance is The sample IQR is Which of the following is a boxplot of the data?
e times (in seconds) between fifteen consecutive eruptions of a geyser were as follows: 914, 900, 883, 919, 940, 949, 933, 880, 918, 928, 855, 899, 926, 883, 907 By entering the data into R, find the following (giving answers to two decimal places): The sample mean is The sample variance is The sample IQR is Which of the following is a boxplot of the data?

Algebra & Trigonometry with Analytic Geometry
13th Edition
ISBN:9781133382119
Author:Swokowski
Publisher:Swokowski
Chapter5: Inverse, Exponential, And Logarithmic Functions
Section5.6: Exponential And Logarithmic Equations
Problem 69E

Related questions
Topic Video
Question
e times (in seconds) between fifteen consecutive eruptions of a geyser were as follows:
914, 900, 883, 919, 940, 949, 933, 880, 918, 928, 855, 899, 926, 883, 907
By entering the data into R, find the following (giving answers to two decimal places):
The sample mean is
The sample variance is
The sample IQR is
Which of the following is a boxplot of the data?
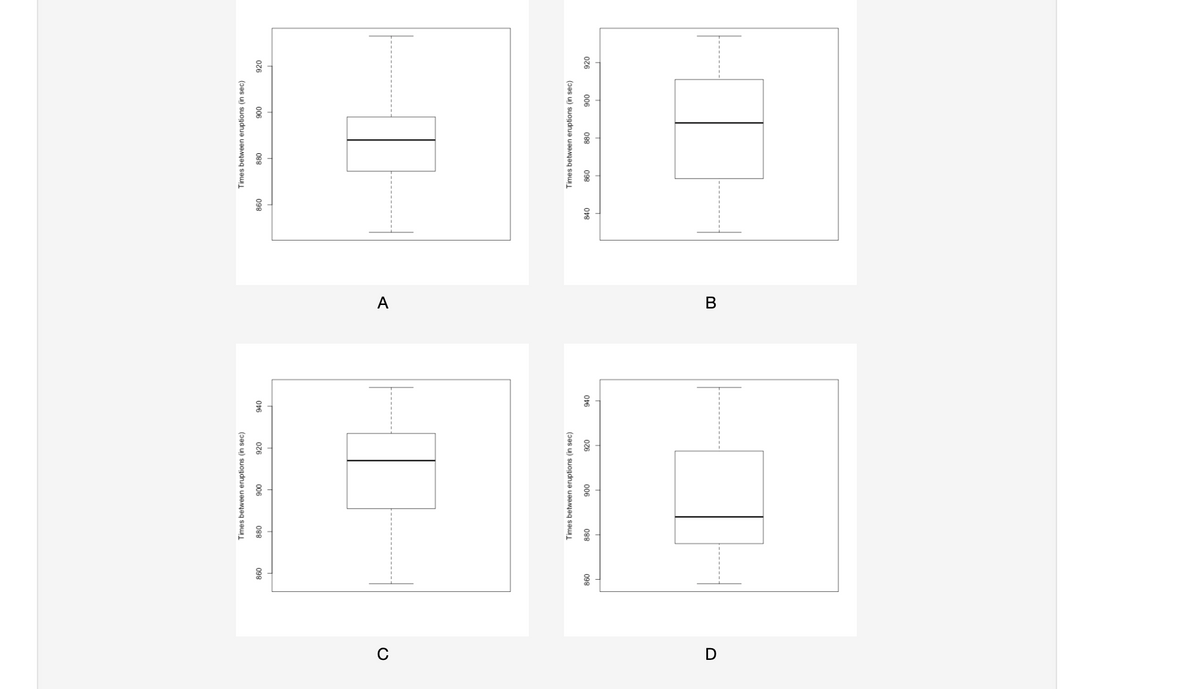
Transcribed Image Text:A
В
D
026
06
088
098
026
006
088
098
Times between eruptions (in sec)
Times between eruptions (in sec)
026
006
088
098
026
006
088
098
Times between eruptions (in sec)
Times between eruptions (in sec)
Expert Solution
This question has been solved!
Explore an expertly crafted, step-by-step solution for a thorough understanding of key concepts.

This is a popular solution!

Trending now
This is a popular solution!

Step by step
Solved in 2 steps with 1 images

Knowledge Booster


Learn more about
Need a deep-dive on the concept behind this application? Look no further. Learn more about this topic, statistics and related others by exploring similar questions and additional content below.Recommended textbooks for you
Algebra & Trigonometry with Analytic Geometry
Algebra
ISBN:
9781133382119
Author:
Swokowski
Publisher:
Cengage
Algebra & Trigonometry with Analytic Geometry
Algebra
ISBN:
9781133382119
Author:
Swokowski
Publisher:
Cengage