e? what is the state alternative hypothesis?

Glencoe Algebra 1, Student Edition, 9780079039897, 0079039898, 2018
18th Edition
ISBN:9780079039897
Author:Carter
Publisher:Carter
Chapter10: Statistics
Section10.5: Comparing Sets Of Data
Problem 13PPS

Related questions
Question
e? what is the state alternative hypothesis?
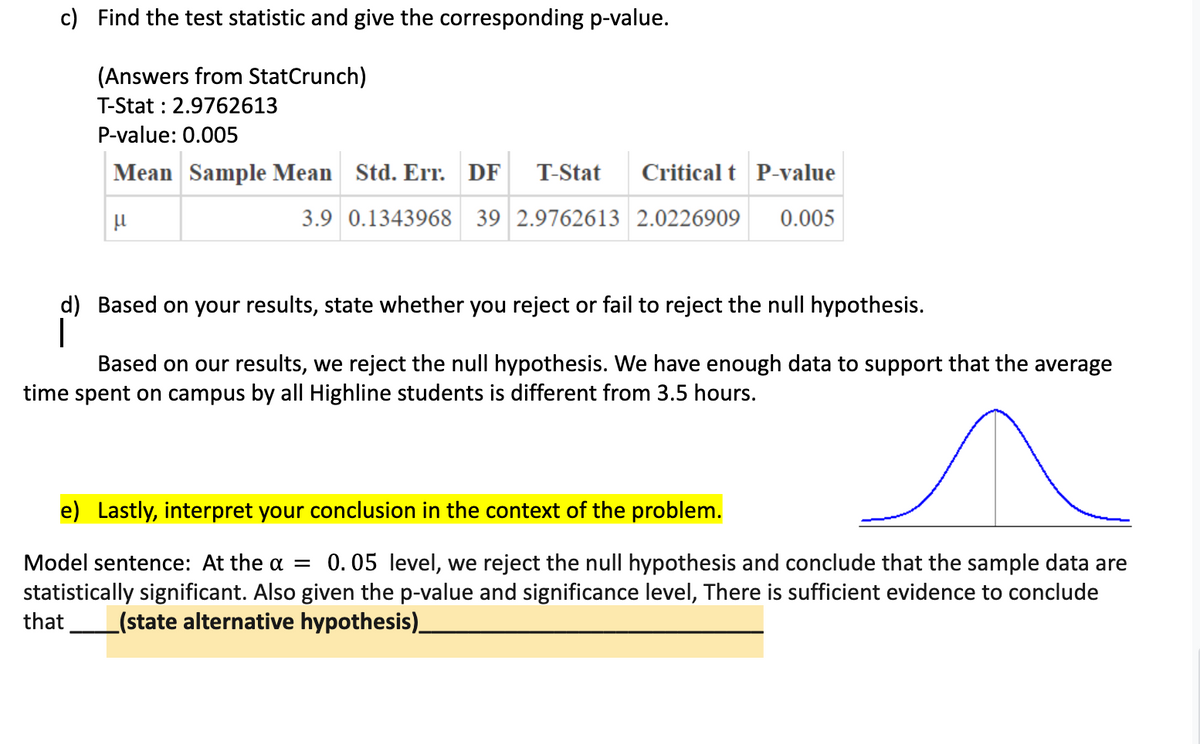
Transcribed Image Text:c) Find the test statistic and give the corresponding p-value.
(Answers from StatCrunch)
T-Stat : 2.9762613
P-value: 0.005
Mean Sample Mean Std. Err. DF T-Stat Critical t P-value
3.9 0.1343968 39 2.9762613 2.0226909 0.005
μ
d) Based on your results, state whether you reject or fail to reject the null hypothesis.
Based on our results, we reject the null hypothesis. We have enough data to support that the average
time spent on campus by all Highline students is different from 3.5 hours.
e) Lastly, interpret your conclusion in the context of the problem.
Model sentence: At the α = 0.05 level, we reject the null hypothesis and conclude that the sample data are
statistically significant. Also given the p-value and significance level, There is sufficient evidence to conclude
that (state alternative hypothesis)__
Expert Solution
This question has been solved!
Explore an expertly crafted, step-by-step solution for a thorough understanding of key concepts.

Step by step
Solved in 2 steps

Recommended textbooks for you
Glencoe Algebra 1, Student Edition, 9780079039897…
Algebra
ISBN:
9780079039897
Author:
Carter
Publisher:
McGraw Hill
Glencoe Algebra 1, Student Edition, 9780079039897…
Algebra
ISBN:
9780079039897
Author:
Carter
Publisher:
McGraw Hill