e. What is the value of the observed test statistic, t, associated with the hypothesis test?
e. What is the value of the observed test statistic, t, associated with the hypothesis test?

Linear Algebra: A Modern Introduction
4th Edition
ISBN:9781285463247
Author:David Poole
Publisher:David Poole
Chapter7: Distance And Approximation
Section7.3: Least Squares Approximation
Problem 31EQ

Related questions
Question
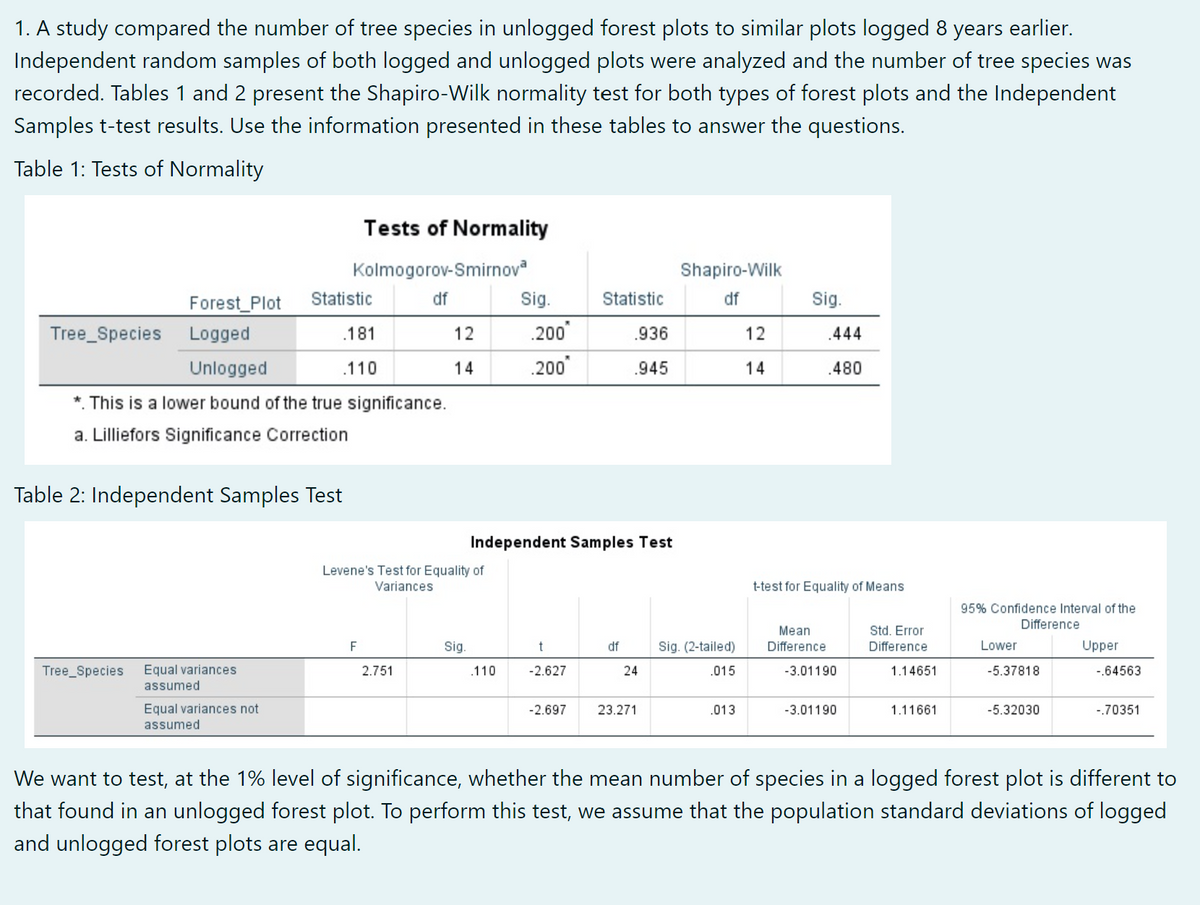
Transcribed Image Text:1. A study compared the number of tree species in unlogged forest plots to similar plots logged 8 years earlier.
Independent random samples of both logged and unlogged plots were analyzed and the number of tree species was
recorded. Tables 1 and 2 present the Shapiro-Wilk normality test for both types of forest plots and the Independent
Samples t-test results. Use the information presented in these tables to answer the questions.
Table 1: Tests of Normality
Tests of Normality
Kolmogorov-Smirnov
Shapiro-Wilk
Forest Plot
Statistic
df
Sig.
Statistic
df
Sig.
Tree_Species Logged
.181
12
.200
.936
12
.444
Unlogged
.110
14
.200
.945
14
.480
*. This is a lower bound of the true significance.
a. Lilliefors Significance Correction
Table 2: Independent Samples Test
Independent Samples Test
Levene's Test for Equality of
Variances
t-test for Equality of Means
95% Confidence Interval of the
Difference
Mean
Std. Error
F
Sig.
t
df
Sig. (2-tailed)
Difference
Difference
Lower
Upper
Equal variances
assumed
Tree_Species
2.751
.110
-2.627
24
.015
-3.01190
1.14651
-5.37818
-.64563
Equal variances not
assumed
-2.697
23.271
.013
-3.01190
1.11661
-5.32030
-.70351
We want to test, at the 1% level of significance, whether the mean number of species in a logged forest plot is different to
that found in an unlogged forest plot. To perform this test, we assume that the population standard deviations of logged
and unlogged forest plots are equal.
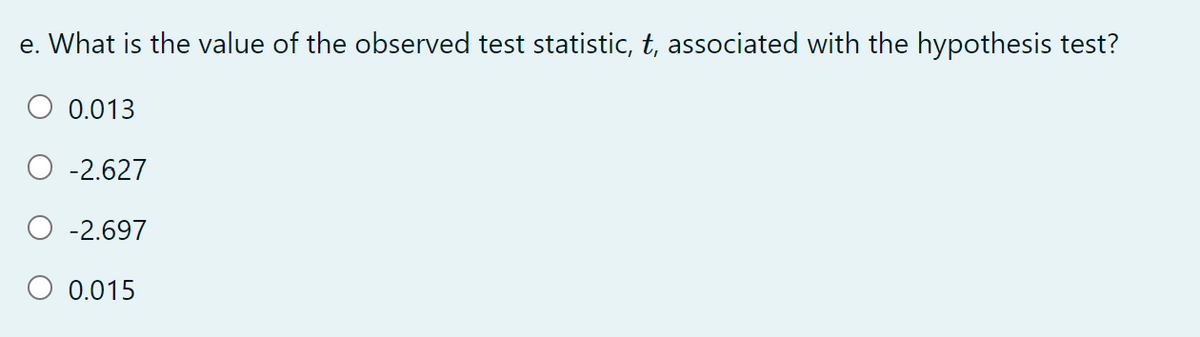
Transcribed Image Text:e. What is the value of the observed test statistic, t, associated with the hypothesis test?
0.013
-2.627
-2.697
O 0.015
Expert Solution
This question has been solved!
Explore an expertly crafted, step-by-step solution for a thorough understanding of key concepts.

Step by step
Solved in 2 steps

Recommended textbooks for you
Linear Algebra: A Modern Introduction
Algebra
ISBN:
9781285463247
Author:
David Poole
Publisher:
Cengage Learning
Linear Algebra: A Modern Introduction
Algebra
ISBN:
9781285463247
Author:
David Poole
Publisher:
Cengage Learning