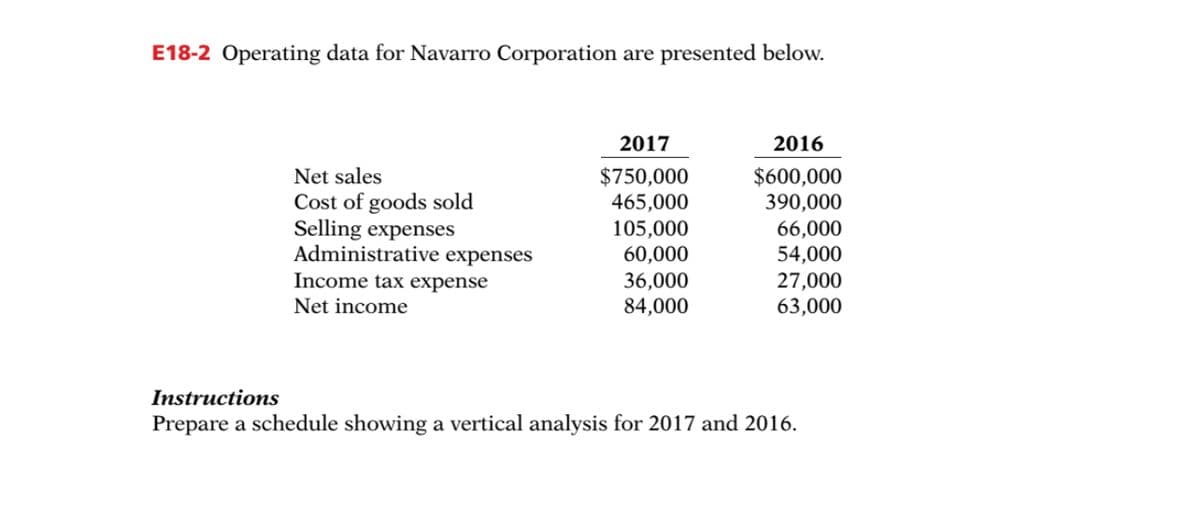
E18-2 Operating data for Navarro Corporation are presented below. 2017 2016 Net sales Cost of goods sold Selling expenses Administrative expenses Income tax expense $750,000 465,000 105,000 60,000 36,000 84,000 $600,000 390,000 66,000 54,000 27,000 63,000 Net income Instructions Prepare a schedule showing a vertical analysis for 2017 and 2016.
Q: Property, plant and equipment 528 447 Development costs 110 93 638 540 Current assets…
A: Cash flow statement is a statement used to see the movement of cash in an organization. Cash flows…
Q: TLC Company Comparatiove Statement of Comprehensie Income For Year 2015 and 2016 2016 2015 Net Sales…
A: Ratio analysis is the one of the important technique of management accounting. Under this, various…
Q: Operating data for Riverbed Corp are presented below. 2022 2021 Sales revenue $850,500…
A: Vertical analysis: It is a method of analyzing the financial statement in which each item is shows…
Q: P18-5 Selected financial data of Target and Wal-Mart for a recent year are presented here (in…
A: Accounting Ratios are the financial tools used to interpret the financial statements of…
Q: The following condensed income statements of the Jackson Holding Company are presented for the two…
A: The revised income statement for 2018 and 2017 year ended December 31 is as follows: The results of…
Q: The following balances are taken from the Statement of Comprehensive Income of JR Bellen Trading.…
A: Income statement: It refers to a financial statement that presents all the income earned by the…
Q: Questions: Selected comparative statement data for Rawan Products Company. All balance sheet data…
A: A balance sheet is a financial statement that shows the assets, liabilities, and shareholder equity…
Q: Cullumber Appliances Corporation has reported its financial results for the year ended December 31,…
A: Ratio analysis means where different ratio of various years of years companies has been compared and…
Q: Operating data for Azam Corporation are presented below…
A: Formula: Gross profit = Sales - Cost of goods sold Deduction of cost of goods sold from sales value…
Q: LOGIC COMPANY Comparative Income Statement For Years Ended December 31, 2017 and 2018…
A: Accounts receivable is the amount that has been earned by the company but the payment for the same…
Q: Questions: Selected comparative statement data for Rawan Products Company . All balance sheet data…
A: Hi student Since there are multiple subparts, we will answer only first three subparts. If you want…
Q: LOGIC COMPANY Comparative Income Statement For Years Ended December 31, 2017 and 2018…
A: What is meant by ratio analysis? An analysis of the financial statement carried out to have an…
Q: The comparative statements of Sheridan Company are presented here. SHERIDAN COMPANY Income…
A: 1. Ratio Analysis - Ratio Analysis shows the various analysis of the financial statement and helps…
Q: Below are the selected financial data of Edgewater Company and Ritter Company for the year ended…
A: Since you have posted a question with multiple sub-parts, we will solve first three subparts for…
Q: The comparative statements of Corbin Company are presented below. CORBIN COMPANY Income Statement…
A: Current ratio is the ratio which show whether sufficient current assets are backed in order to meet…
Q: Compute the following ratios for 2022. (Round Earnings per share, Current ratio and Asset turnover…
A:
Q: With the information provided in the image: Prepare a multi-step income statement. Calculate the…
A: Calculate multi-step income statement of Longo & Company:
Q: Operating data for Azam Corporation are presented below 2018 2017 Net Sales Rs. 75,000 Rs.…
A: Azam Corporation…
Q: BE18-8 Vertical analysis (common size) percentages for Kochheim Company's sales revenue, cost of…
A: Net income = Sales revenue - Cost of goods sold - Expenses
Q: Presented here are an incomplete income statement and balance sheet for Vieux Corporation. VIEUX…
A: Ratio analysis is defined as a method utilized to analyze the results of a business. Various items…
Q: "Keeper Corporation’s income statement for the year ended June 30, 2014, and its comparative balance…
A: The question is based on the concept of the CashFlow Statement.
Q: S18-1 Horizontal analysis McCormick Ltd reported the following on its comparative income statement:…
A: Gross Profit = Revenue - Cost of Sales
Q: Kincaid Company reported the following data (in millions) for the past two years:2019…
A: Financial statement analysis Financial statement analysis are analyzed to understand the…
Q: Operating data for Krystal Corporation are presented below. 2013 2012 Net sales P600,000 390,000…
A: The vertical analysis evaluates the current performance of the entity and horizontal analysis…
Q: LOGIC COMPANY Comparative Income Statement For Years Ended December 31, 2017 and 2018…
A: Ratio analysis is a financial accounting technique to measure the overall performance and health of…
Q: The following data relate to Alpha Company: 2018 2017 Sales P500,000 P400,000 Cost of Goods Sold…
A: Under horizontal analysis, intra firm data of different period is compared to analyse the impact of…
Q: The summarized financial statements of Dutch Baby Berhad for the period ended 31 December 2015 were…
A: Ratio analysis is one of the quantitative approaches adopted by the analysts and top level…
Q: Compute each year’s current ratio, debt-to-equity ratio, profit margin, return on total assets.…
A: “Since you have posted a question with multiple sub-parts, we will be solving only the first 3…
Q: Comparative financial statement data for Flounder Corp. and Blue Spruce Corp., two competitors,…
A: Ratio Analysis: Ratio analysis is a process of determining the relationship between accounting…
Q: Operating data for Taylor Corporation are presented below. Using the Excel spreadsheet provided,…
A: Vertical analysis of a financial statement is done by expressing each item of the financial…
Q: LOGIC COMPANY Comparative Income Statement For Years Ended December 31, 2017 and 2018…
A: What is meant by ratio analysis? An analysis of the financial statement carried out to have an…
Q: Pharoah Corporation recently filed the following financial statements with the SEC. Pharoah…
A: Definition: Current ratio: The financial ratio which evaluates the ability of a company to pay off…
Q: Selected financial statement data for Schmitzer Inc. is shown below: 2016 2015 Balance sheet:…
A: d
Q: LOGIC COMPANY Comparative Income Statement For Years Ended December 31, 2017 and 2018…
A: Asset Turnover Ratio: A company's asset turnover ratio is a measure of the efficiency with which its…
Q: Performing horizontal analysis—income statement Data for Mulberry Designs, Inc. follow: Requirements…
A:
Q: The comparative condensed income statements of Emley Corporation are shown below. EMLEY CORPORATION…
A: Required: Horizontal Analysis of income statement Vertical Analysis of income statement
Q: [The following information applies to the questions displayed below.] Selected comparative financial…
A: Current ratio = Current assets / Current liabilities
Q: Operating data for Flounder Corp. are presented below. 2017 2016 Sales revenue $825,400 $628,400…
A: Definition: Vertical analysis: The comparison of an item of a financial statement against the total…
Q: Van der Man Fashions, Inc. Income Statement Years Ended December 31, 2018 and 2017 2018 2017 236,000…
A: Average accounts = ( Previous year account + Current year account ) / 2 So , Average inventory = (…
Q: Selected financial statement data for Schmitzer Inc. is shown below:2018 2017Balance…
A: The first step in above computation is to arrive at the amount of Average invevntory. The Average…
Q: The Cullumber Supply Company reported the following information for 2017. Prepare a common-size…
A: The income statement represents the net income or net loss calculated by deducting the expenses from…
Q: LOGIC COMPANY Comparative Income Statement For Years Ended December 31, 2017 and 2018…
A: The total-debt-to-total-assets leverage ratio likens a company's total debt to total assets. This…
Q: Income statement data for Bezos Company for the years ended December 31, 2014 and 2013, are as…
A: Horizontal analysis is prepared to show increase and decrease in amount by the line item. In this,…
Q: Consider the following income statement data from the Ross Company: 2013 2012 Sales revenue $529,000…
A: Given that common size income statement to be prepared based on 'Percent of sales revenue' It is…
Q: LOGIC COMPANY Comparative Income Statement For Years Ended December 31, 2017 and 2018…
A: Ratio analysis: Ratio analysis is a tool that establishes a relationship between the different…
Q: LOGIC COMPANY Comparative Income Statement For Years Ended December 31, 2017 and 2018…
A: Ratio analysis is a financial accounting technique to measure the overall performance and health of…
Q: Please help
A: Divided each element with the Sales of the particular Year.
Trending now
This is a popular solution!
Step by step
Solved in 2 steps
- Profitability ratios The following selected data were taken from the financial statements of Robinson Inc. for December 31, 2016, 2015 and 2014: December31 2016 2015 2014 Total assets......................................... 4,800,000 4,400,000 4,000,000 Notes payable (8% interest)........................... 2,250,000 2,250,000 2,250,000 Common stock...................................... 250,000 250,000 250,000 Preferred 4% stock, 100 par (no change during year)........................... 500,000 500,000 500,000 Retained earnings................................... 1,574,000 1,222,000 750,000 The 2016 net income was 372,000, and the 2015 net income was 492,000. No dividends on common stock were declared between 2014 and 2016. a. Determine the rate earned on total assets, the rate earned on stockholders equity, and the rate earned on common Stockholders equity for the years 2015 and 2016. Round to one decimal place. b. What conclusions can be drawn from these data as to the companys profitability?Twenty metrics of liquidity, solvency, and profitability The comparative financial statements of Automotive Solutions Inc. are as follows. The market price of Automotive Solutions Inc. common stock was $119.70 on December 31, 20Y8 Instructions Return on total assetsTwenty metrics of liquidity, solvency, and profitability The comparative financial statements of Automotive Solutions Inc. are as follows. The market price of Automotive Solutions Inc. common stock was $119.70 on December 31, 20Y8 Instructions Debt ratio
- Twenty metrics of liquidity, solvency, and profitability The comparative financial statements of Automotive Solutions Inc. are as follows. The market price of Automotive Solutions Inc. common stock was $119.70 on December 31, 20Y8 Instructions Ratio of fixed assets to long-term liabilitiesProfitability metrics The following selected data were taken from the financial statements of The O'Malley Group Inc. for December 31, 20Y5. 20Y4. and 20Y3: No dividends on common stock were declared between 20Y3 and 20Y5. a.Determine the return on total assets, the return on stockholders' equity, and the return on common stockholders' equity Tor the years 20Y4 and 20Y5. Round to one decimal place. b. What conclusions can be drawn from these data as to the company's profitability?Twenty metrics of liquidity, solvency, and profitability The comparative financial statements of Automotive Solutions Inc. are as follows. The market price of Automotive Solutions Inc. common stock was $119.70 on December 31, 20Y8 Instructions Asset turnover
- Selected comparative statement data for Oriole Company are presented below. All balance sheet data are as of December 31. 20222021Net sales$1,165,000 $1,125,000Cost of goods sold705,000 645,000Interest expense20,000 15,000Net income154,945 145,000Accounts receivable145,000 125,000Inventory105,000 100,000Total assets785,000 700,000Preferred stock (6%)205,000 200,000Total stockholders’ equity635,000 525,000 Compute the following ratios for 2022. (Round answers to 1 decimal place, e.g. 1.8 or 2.5%) (a)Profit marginenter the profit margin in percentages %(b)Asset turnoverenter the asset turnover in times times(c)Return on assetsenter the return on assets in percentages %(d)Return on common stockholders’ equityenter the return on common stockholders' equity in percentages %The comparative statements of Corbin Company are presented below. CORBIN COMPANYIncome StatementFor the Years Ended December 31 2017 2016 Net sales (all on account) $600,500 $520,200 Expenses Cost of goods sold 414,600 354,200 Selling and administrative 119,900 113,300 Interest expense 8,200 5,100 Income tax expense 17,100 14,700 Total expenses 559,800 487,300 Net income $ 40,700 $ 32,900 CORBIN COMPANYBalance SheetsDecember 31 Assets 2017 2016 Current assets Cash $ 21,100 $ 17,600 Short-term investments 17,100 15,200 Accounts receivable (net) 86,100 73,000 Inventory 89,400 70,100 Total current assets 213,700 175,900 Plant assets (net) 423,800 383,200 Total assets $637,500 $559,100 Liabilities and Stockholders’ Equity…Operating data for Navarro Corporation are presented below: 2017 2016 Net sales $750,000 $600,000 Cost of goods sold 465,000 390,000 Selling expenses 105,000 66,000 Administrative expenses 60,000 54,000 Income tax expense 36,000 27,000 Net income 84,000 63,000 Instructions: Prepare a schedule showing a vertical analysis for 2017 and 2016?
- 9 Operating data for Taylor Corporation are presented below. Using the Excel spreadsheet provided, prepare a schedule showing a vertical analysis for 2018 and 2017. 2018 2017 Sales revenue $800,000 $600,000 Cost of goods sold 520,000 408,000 Selling expenses 120,000 72,000 Administrative expenses 60,000 48,000 Income tax expense 30,000 24,000 Net income 70,000 48,000 (CGS percent. = CGS ÷ Sales rev.)Presented below is the 2018 income statement and comparative balance sheet information for Tiger Enterprises.TIGER ENTERPRISESIncome StatementFor the Year Ended December 31, 2018($ in thousands)Sales revenue $7,000Operating expenses:Cost of goods sold $3,360Depreciation 240Insurance 100Administrative and other 1,800Total operating expenses 5,500Income before income taxes 1,500Income tax expense 600Net income $ 900Balance Sheet Information ($ in thousands) Dec. 31, 2018 Dec. 31, 2017Assets:Cash $ 300 $ 200Accounts receivable 750 830Inventory 640 600Prepaid insurance 50 20Plant and equipment 2,100 1,800Less: Accumulated depreciation (840) (600)Total assets $3,000 $2,850Liabilities and Shareholders’ Equity:Accounts payable $ 300 $360Payables for administrative and other expenses 300 400Income taxes payable 200 150Note payable (due 12/31/2019) 800 600Common stock 900 800Retained earnings 500 540Total liabilities and shareholders’ equity $3,000 $2,850Required:Prepare Tiger’s statement of…Operating data for Azam Corporation are presented below 2018 2017 Net Sales Rs. 75,000 Rs. 600,000 Cost of Goods Sold 480,000 408,000 Selling Expenses 105,000 84,000 Administrative Expense 75,000 54,000 Income Tax Expense 36,000 18,000 Net Income 54,000 36,000 Required: Prepare a schedule showing a vertical analysis for 2018 and 2017