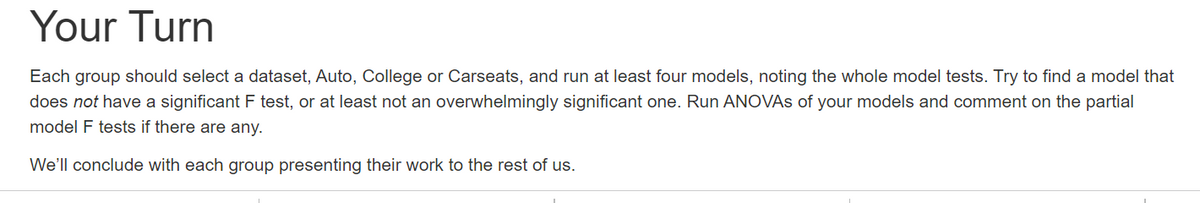
Each group should select a dataset, Auto, College or Carseats, and run at least four models, noting does not have a significant F test, or at least not an overwhelmingly significant one. Run ANOVAS of model F tests if there are any. We'll conclude with each group presenting their work to the rest of us.
Q: Year Project A Project B -$5,000 -$10,000 $1,250 $1,100
A: Given as,
Q: A regression was run to determine if there is a relationship between hours of TV watched per day (x)…
A: The independent variable is of TV watched per day. The dependent variable is number of situps a…
Q: 2. Let X,, X,.X, be a random sample from a distribution with p.d.f. 2..... f(x;0) = 0 x, Is the MLE…
A: Given that
Q: If necessary, consult a list of formulas.) (a) The 25th percentile: miles (b) The 60th percentile:…
A:
Q: Q/ In the vehicle speed test, the results are given in the table below: Find 1. Arithmetic mean 2.…
A:
Q: Problem 2 A class contains seven boys and eight girls. (a) If two are selected at random to leave…
A: Given that, a class contains seven boys and eight girls. (a) If two are selected at random to leave…
Q: Here is a bivariate data set. x y 20.9 34.2 31.4 144.9 44.3 84.7 55.4 79.8 58.9 50.8 68.7…
A: Given a bivariate data set. x y 20.9 34.2 31.4 144.9 44.3 84.7 55.4 79.8 58.9 50.8…
Q: Make an illustration of how you understand the key concept of sampling. Hint: part of a whole
A: The sаmрling frаme is the асtuаl list оf individuаls thаt the sаmрle will be drаwn…
Q: Sample of 75 are selected from a population with mean 29 and standard deviation of 7.5. The mean of…
A: Given that n=75 Mean=29 Standard deviation=7.5
Q: p-p Evaluate the formula z = 114 n = 500, p = 0.25, and q = 1- p. when p= 500
A:
Q: 4. A university department maintains an emergency computer repair shop. History shows that broken…
A:
Q: According to the National Association of Colleges and Employers, the 2015 average starting salary…
A: A continuous random variable X is said to follow Normal distribution with parameters μ and σ2 if its…
Q: Let x be a random variable that represents the level of glucose in the blood (milligrams per…
A: Given that, μ=62,σ=40 (a) The probability that, on a single test, x < 40 is,
Q: Studies suggest that women who smoke during pregnancy affect the birth weights of their newborn…
A: Disclaimer : “Since you have posted a question with multiple sub-parts, we will solve first three…
Q: 1 Dataset 20 3 6 4 15 22 13 7 9 2 9 20 10 10
A:
Q: (a) A survey was conducted where 68.6% of people said their favourite cuisine is Malaysian. A random…
A:
Q: Three different checkpoints in a water distribution system are tested for bacterial contamination.…
A: Disclaimer : Since you have asked multiple question, we will solve the one question for you. If you…
Q: Studies suggest that women who smoke during pregnancy affect the birth weights of their newborn…
A: (c ) Use EXCEL to determine the regression equation. EXCEL procedure: Go to EXCEL Go to…
Q: one you would normally buy?" Of these users, 62% responded that they would buy the CD. CD with this…
A: Given N=704 Level of significance =0.01
Q: Group Statistics Std. Std. Error Neighbourhood Trips A N Mean Deviation Mean 7 22.29 16.760 6.335 B…
A: There are two independent samples which are Neighbourhood A and Neighbourhood B. We have to test…
Q: The weakest form of data with regard to statistical analysis is: a) Ratio-scaled data b)…
A: It is known that there are four type of level of measurement : nominal, ordinal, interval and ratio.…
Q: What is the probability of randomly selecting a Female or a New product? New product Old product…
A: We have given that the data into a cross tabulation form. Total number of persons = 73
Q: The amount of time that people spend at Grover Hot Springs is normally distributed with a mean of 64…
A: Given that The amount of time that people spend at Grover Hot Springs is normally distributed with…
Q: How might investigators doing different types of studies, such as sample surveys and experiments,…
A: Sample size determination in Sample Surveys and experiments
Q: The diameter of a brand of tennis balls is approximately normally distributed, with a mean of 2.72…
A: Given that Population Mean (\mu)(μ) = 2.722.72 Population Standard Deviation (\sigma)(σ) =…
Q: 2. The table shows the frequency distribution of 60 employees and their daily wages. First find the…
A: Class size=upper limit- lower limit
Q: Click here to view page 2 of the table of areas under the standard normal curve, Areas under the…
A: We have given that Sample size n = 18 Population standard deviation = 1.84 The sum of the data =…
Q: 80.2
A:
Q: Question 3: A game of zumpie consists of 3 teams; 2 teams lose and 1 team wins. Fifty-one teams…
A:
Q: Use a four-week moving average to develop a forecast for week 6. Use exponential smoothing with a…
A: This question is of time series. Moving avg , exp. smoothing etc are the methods to forecast. Given…
Q: 8. The distribution of incomes of persons whose incomes exceed 0 cedis per annum is believed to…
A: Find Method of moment MLE θ
Q: Which one of the following would be a possible p-value for the hypotheses: Ho : μ = 0 versus H1 : μ…
A: Here Given Hypothesis Ho : μ = 0 versus H1 : μ ≠ 0
Q: If the first drawn page has moderate graphics, what is the probability that there are no pages with…
A: A small-business Web site contains 100 pages and 60%, 30%, and 10% of the pages contain low,…
Q: Example 32. a line so that all the girls sit together and all the boys sit together, Find the number…
A:
Q: A random sample of Starburst candies was collected and the number of each color counted. The results…
A: It is needed to test, whether the proportions of different colors of candies are not all equal.
Q: Q1: A study is conducted involving ten patients to investigate the relationship and effects of…
A: Correlation coefficient is given by, Here n= 10 Σy2= 202094 All the values are given so, r=…
Q: Interpret the coefficient of determination using the table below? SUMMARY OUTPUT
A: From the output, the R square value is 0.9843.
Q: Find the central moments µ, and µ̟ and also the coefficients of Skewness and Kurtosis, for a…
A:
Q: 2. Suppose that Z, and Z, have a joint probability density function given by (1 – z,2), 0 sz, S 1,…
A:
Q: Briefly discuss the difference between quantitative and qualitative random variables, giving…
A: Quantitative Variable: The variable whose values are countable or measuring the values. Quantitative…
Q: Describe the properties of range, mean deviation, and standard deviation.
A: Properties of range:- 1.) The value of range is always non-negative. (either positive or equal to…
Q: Conduct an ANOVA test to determine if Subjective well-being (slm_01) differs by Ethnic or cultural…
A: Since we answer only up-to three subparts of a problem, we'll be answering the first three sub…
Q: Questions 15-18 use the following information. Suppose in a sample of 5 men that their monthly…
A: Solution: Given information: k= 2 independent variables n= 5 observation.
Q: b) At Westem Sydney University, students can enroll in Hyflex classes. This means they can either…
A: Solution
Q: The time required to repair a machine is an exponentially distributed random variable with mean of…
A: A machine is exponentially distributed with mean 0.5 hour
Q: After collecting considerable data, the engineers decided to model the variation in shaft diameter…
A: Mean(µ) = 10.1Standard deviations (σ) = 2.7X ~ N (µ, σ )= N(10.1, 2.7)
Q: Weakly ordered data denotes each value getting a ranked position. Strongly ordered data denotes…
A: As per our guidelines we are supposed to answer only one question per post so i am solving first…
Q: 21. Television Watching The average number of hours of television watched per week by women over age…
A: Given that Sample sizes n1=40 , n2=40 Sample means X̄1=48.2 , X̄2=44.3 ?1…
Q: Theorem :- show That x6 $s an unbaised estimate of P in binomil distribution
A:
Q: Let X be a continuous random variable with probability density functic (PDF) given by f(x) = {cx?…
A: Given that X be a continuous random variable with probability density functions of X is f(x)= cx2…
Step by step
Solved in 2 steps
- A recent study claims that using music in a class enhances concentration and consequently helps students absorb more information. A researcherdecided to test this claim on a smaller group of randomly selected students from three different classes. Each classroom was provided with a different environment for students to study. Classroom A had constant music being played in the background, classroom B had variable music being played and classroom C was a regular class with no music playing. After one month, the researcher conducted a test for all the three groups and ranked their scores. What statistical test would be most appropriate for testing the research hypothesis? Explain your answer.A developmental psychologist is studying bonding between healthy newborn babies and immediate family members. He wants to know if one-week-old infants use smell to recognize their fathers. To investigate, he selects a random sample of one-week-old infants. Each infant is presented with a garment worn by his or her father and two garments worn by unrelated men. The psychologist observes which garment each of the infants orients toward. The resulting data are summarized in the following table that shows the number of infants who oriented toward each of the three garments. What is are the degrees of freedom for this experiment? 4 3 1 2The University is considering changing the email system that they currently use. Since there are substantial learning costs associated with any new software, the University only wants to change to the new system if it is very confident that there is at least a 20% difference in the proportion of faculty and staff who say they like the new system. In a sample of 120 users of the current system, the University finds that 65 say they like the current system. In another sample of 90 experimental users of the “new” system, the University finds that 70 of them like the new system. When testing the hypothesis (using a 5% level of significance) that there is at least a 20% difference in the proportion of users who like the two systems, the p-value is .2943; what is your conclusion concerning the null hypothesis? Reject the null hypothesis Fail to reject the null hypothesis
- Two years ago the manager of a local supermarket that sells three national brands (brands A, B, and C) and one store brand (brand D) of orange juice found that brands A and C were equally preferred, 33% preferred brand B, and 27% preferred the store brand, D. Now, the manager thinks that there has been a change in customer preferences and that the preference for store-brand orange juice has increased and perhaps will positively contribute to increased profits. The results from a recent random sample of shoppers indicate the following preferences.Favorite brand A B C D (store brand)Number 56 70 28 126Has there been a change in customer preferences from the study 2 years ago?A panel of dentists is interested in testing two different toothpaste brands (A and B) to see if there is a relationship between the brand and whether or not the patient has a cavity at their next appointment. A representative sample of 60 patients is recruited to take part in this study. At their first appointment of the year, each subject is assigned to brush their teeth with one of the two brands for the next six months. At their follow-up appointment six months later, they were checked for cavities. ******In the sample, 6 of the 30 patients assigned to Brand A were found to have a cavity. The fraction 6/30 should be denoted by which of the following? μ x̄ p p̂ n s σ χ²A panel of dentists is interested in testing two different toothpaste brands (A and B) to see if there is a relationship between the brand and whether or not the patient has a cavity at their next appointment. A representative sample of 60 patients is recruited to take part in the study. At their first appointment of the year, each subject is assigned to brush their teeth with one of the two brands for the next six months. At their follow-up appointment six months later, they were checked for cavities. What method of data collection was used? Select one: a.Experiment b.Observational Study
- A panel of dentists is interested in testing two different toothpaste brands (A and B) to see if there is a relationship between the brand and whether or not the patient has a cavity at their next appointment. A representative sample of 60 patients is recruited to take part in the study. At their first appointment of the year, each subject is assigned to brush their teeth with one of the two brands for the next six months. At their follow-up appointment six months later, they were checked for cavities. To test for significance of their findings, which of the following should the dentists use? Select one: a.Paired t-test b.One-sample t-test for a mean c.Linear Regression d.One-sample Z-test for a proportion e.Chi-Square test for independence f.Two-Sample t-test g.One-sample Z-test for a meanA psychologist conducts a 2 x 3 x 2 ANOVA. How many main effects are possible? How many interactions are possible?In Colorado, there is a large group of deer that spend their summer months in a region on one side of a highway and survive the winter months in a lower region on the other side. To determine if the highway has disturbed deer migration to the winter feeding area, the following data were gathered on a random sample of 10 wilderness districts in the winter feeding area. Row B represents the average January deer count for a 5-year period before the highway was built, and row A represents the average January deer count for a 5-year period after the highway was built. The highway department claims that the January population has not changed. Test this claim against the claim that the January population has dropped. Use a 5% level of significance. Units used in the table are hundreds of deer. (Let d = B − A.) Wilderness District 1 2 3 4 5 6 7 8 9 10 B: Before highway 10.1 7.2 12.9 5.6 17.4 9.9 20.5 16.2 18.9 11.6 A: After highway 9.3 8.4 10.2 4.1 4.0 7.1 15.2 8.3 12.2 7.3 What…
- An experiment to determine if a migraine medication decreases a person's average number of monthly migraines is performed on 400 people who report they have several migraines a month. Researchers randomly assigned 200 people to the treatment group and 200 people to the control group. After the study, the researchers determined that 48 of the subjects in the treatment group and 28 of the subjects in the control group average fewer migraines per month. The data from the two groups are resampled 150 times, and the table shows the distribution of the differences of the proportions for the reconfigured treatment and control groups.Consider the hypothetical case that there were only two brands of juice on the market, company A and company B. 52% of the population drinks juice from company A (it is not known whether these people consume only juice A or if they also consume juice B). 51% of the population drinks juice of company B (again, it is not known how many of these people drink only juice B or if they drink both juice). However, it is known that 21% of the population does not drink juice. Based on these data, we can estimate that the percentage of the population that drinks juice from both companies is: (choose only one): a) 36% b)37% c) 24% d)23% e)5.3%Consider the hypothetical case that there were only two brands of juice on the market, company A and company B. 52% of the population drinks juice from company A (it is not known whether these people consume only juice A or if they also consume juice B). 51% of the population drinks juice of company B (again, it is not known how many of these people drink only juice B or if they drink both juice). However, it is known that 21% of the population does not drink juice. Based on these data, we can estimate that the percentage of the population that drinks juice from both companies is: (choose only one) a) 56% b) 40% c) 22% d) 23% e) 34%