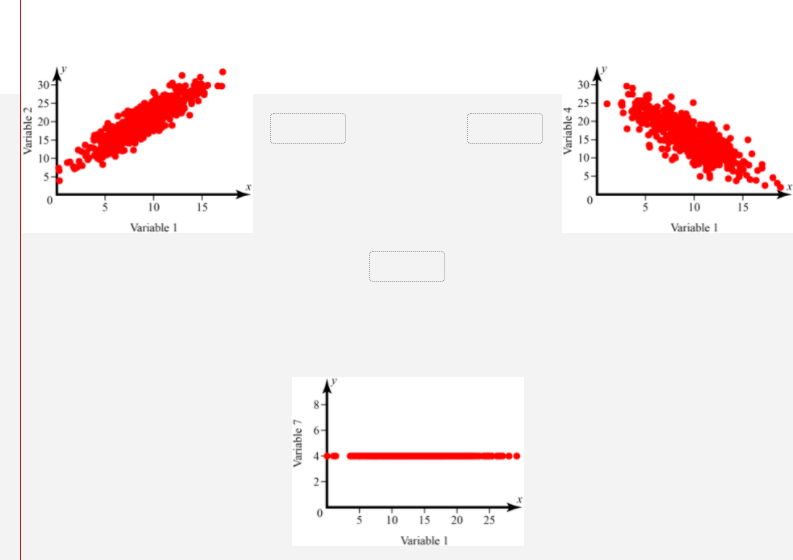
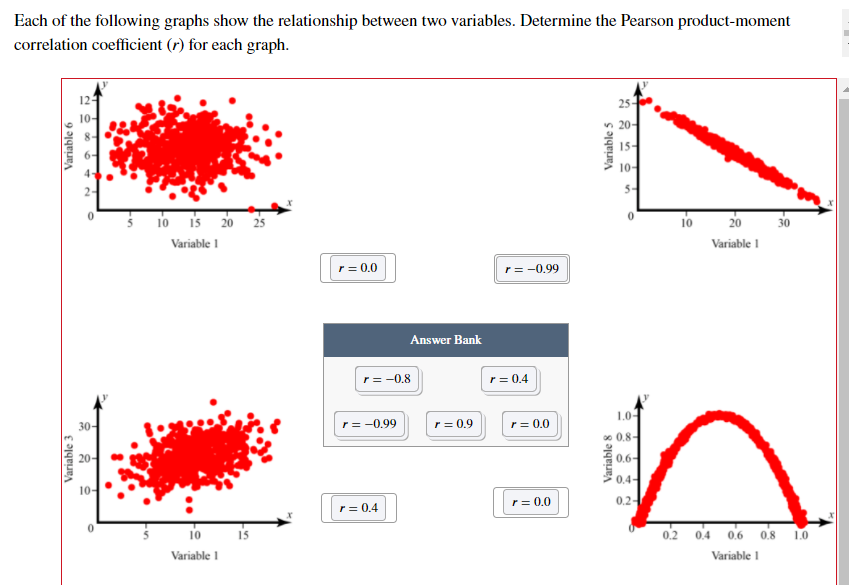
Each of the following graphs show the relationship between two variables. Determine the Pearson product-moment correlation coefficient (r) for each graph.
Each of the following graphs show the relationship between two variables. Determine the Pearson product-moment correlation coefficient (r) for each graph.

Algebra & Trigonometry with Analytic Geometry
13th Edition
ISBN:9781133382119
Author:Swokowski
Publisher:Swokowski
Chapter3: Functions And Graphs
Section3.5: Graphs Of Functions
Problem 48E

Related questions
Question
Make sure to state which answer goes to which graph because I can get confused.
Transcribed Image Text:10
15
10
Variable 1
Variable I
2-
10
15
20
Variable I
Variable 2
Variable 7
Variable 4
Transcribed Image Text:Each of the following graphs show the relationship between two variables. Determine the Pearson product-moment
correlation coefficient (r) for each graph.
25-
n 20-
15-
10-
4-
2-
5-
10
15
20 25
10
20
30
Variable 1
Variable I
r= 0.0
r= -0.99
Answer Bank
r= -0.8
r = 0.4
1.0-
30-
r= -0.99
r = 0.9
r = 0.0
0.8-
20-
0.6-
0,4-
10-
r = 0.0
0.2-
r= 0.4
10
15
0.2 0.4 0.6 0.8
1.0
Variable 1
Variable 1
Variable 3
Variable 6
Variable 8
Variable 5
Expert Solution
This question has been solved!
Explore an expertly crafted, step-by-step solution for a thorough understanding of key concepts.

This is a popular solution!

Trending now
This is a popular solution!

Step by step
Solved in 3 steps with 2 images

Recommended textbooks for you
Algebra & Trigonometry with Analytic Geometry
Algebra
ISBN:
9781133382119
Author:
Swokowski
Publisher:
Cengage

Algebra for College Students
Algebra
ISBN:
9781285195780
Author:
Jerome E. Kaufmann, Karen L. Schwitters
Publisher:
Cengage Learning
Algebra & Trigonometry with Analytic Geometry
Algebra
ISBN:
9781133382119
Author:
Swokowski
Publisher:
Cengage
Algebra for College Students
Algebra
ISBN:
9781285195780
Author:
Jerome E. Kaufmann, Karen L. Schwitters
Publisher:
Cengage Learning