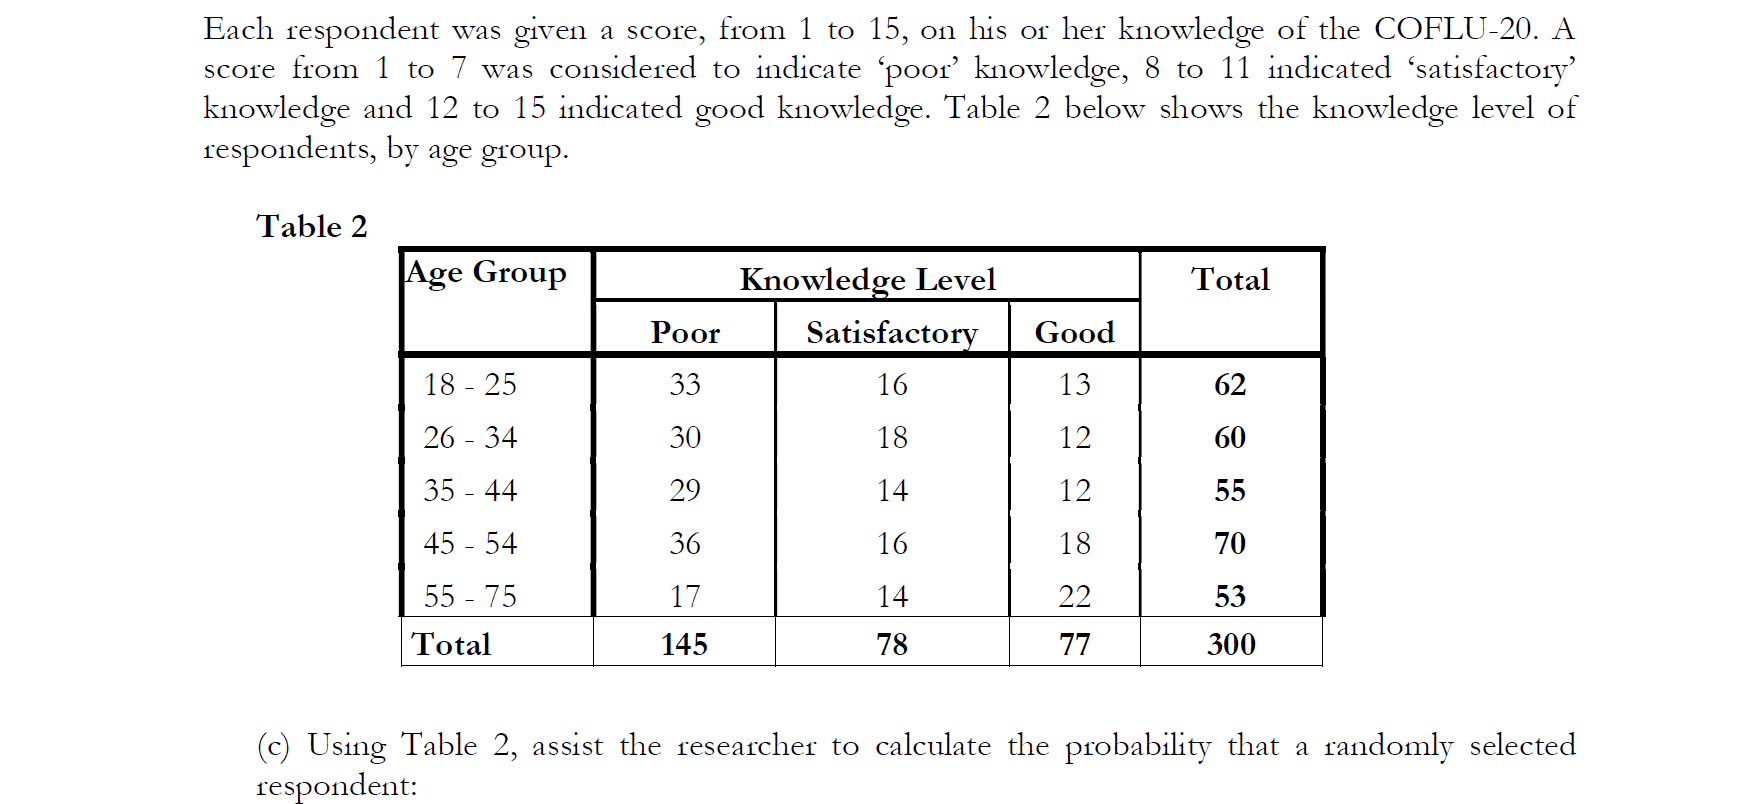
Each respondent was given a score, from 1 to 15, on his or her knowledge of the COFLU-20. A score from 1 to 7 was considered to indicate 'poor' knowledge, 8 to 11 indicated 'satisfactory' knowledge and 12 to 15 indicated good knowledge. Table 2 below shows the knowledge level of respondents, by age group. Table 2 Age Group Knowledge Level Total Poor Satisfactory Good 18 - 25 33 16 13 62 26 - 34 30 18 12 60 35 - 44 29 14 12 55 45 - 54 36 16 18 70 55 - 75 17 14 22 53 Total 145 78 77 300 (c) Using Table 2, assist the researcher to calculate the probability that a randomly selected respondent:
Each respondent was given a score, from 1 to 15, on his or her knowledge of the COFLU-20. A score from 1 to 7 was considered to indicate 'poor' knowledge, 8 to 11 indicated 'satisfactory' knowledge and 12 to 15 indicated good knowledge. Table 2 below shows the knowledge level of respondents, by age group. Table 2 Age Group Knowledge Level Total Poor Satisfactory Good 18 - 25 33 16 13 62 26 - 34 30 18 12 60 35 - 44 29 14 12 55 45 - 54 36 16 18 70 55 - 75 17 14 22 53 Total 145 78 77 300 (c) Using Table 2, assist the researcher to calculate the probability that a randomly selected respondent:

Glencoe Algebra 1, Student Edition, 9780079039897, 0079039898, 2018
18th Edition
ISBN:9780079039897
Author:Carter
Publisher:Carter
Chapter10: Statistics
Section10.5: Comparing Sets Of Data
Problem 14PPS

Related questions
Question
100%
(i) is below 35 years of age and has good knowledge of the COFLU-20
(ii) is below 35 years of age or has good knowledge of the COFLU-20
Transcribed Image Text:Each respondent was given a score, from 1 to 15, on his or her knowledge of the COFLU-20. A
score from 1 to 7 was considered to indicate 'poor' knowledge, 8 to 11 indicated 'satisfactory'
knowledge and 12 to 15 indicated good knowledge. Table 2 below shows the knowledge level of
respondents, by age group.
Table 2
Age Group
Knowledge Level
Total
Poor
Satisfactory
Good
18 - 25
33
16
13
62
26 - 34
30
18
12
60
35 - 44
29
14
12
55
45 - 54
36
16
18
70
55 - 75
17
14
22
53
Total
145
78
77
300
(c) Using Table 2, assist the researcher to calculate the probability that a randomly selected
respondent:
Expert Solution
This question has been solved!
Explore an expertly crafted, step-by-step solution for a thorough understanding of key concepts.

This is a popular solution!

Trending now
This is a popular solution!

Step by step
Solved in 3 steps with 4 images

Knowledge Booster


Learn more about
Need a deep-dive on the concept behind this application? Look no further. Learn more about this topic, statistics and related others by exploring similar questions and additional content below.Recommended textbooks for you
Glencoe Algebra 1, Student Edition, 9780079039897…
Algebra
ISBN:
9780079039897
Author:
Carter
Publisher:
McGraw Hill
Glencoe Algebra 1, Student Edition, 9780079039897…
Algebra
ISBN:
9780079039897
Author:
Carter
Publisher:
McGraw Hill