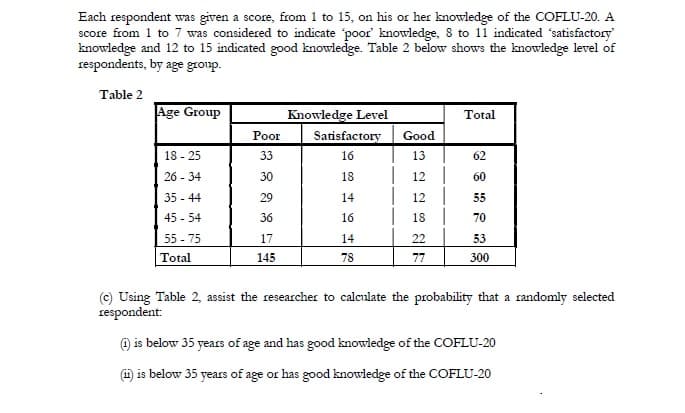
Each respondent was given a score, from 1 to 15, on his or her knowledge of the COFLU-20. A score from 1 to 7 was considered to indicate poor' knowledge, 8 to 11 indicated 'satisfactory knowledge and 12 to 15 indicated good knowledge. Table 2 below shows the knowledge level of respondents, by age group. Table 2 Age Group Knowledge Level Total Poor Satisfactory Good 18 - 25 33 16 13 62 26 - 34 30 18 | 12 | 60 35 - 44 29 14 12 55 45 - 54 36 16 18 70 55 - 75 17 14 22 53 Total 145 78 77 300 (c) Using Table 2, assist the researcher to calculate the probability that a randomly selected respondent: @) is below 35 years of age and has good knowledge of the COFLU-20 (i) is below 35 years of age or has good knowledge of the COFLU-20 91
Each respondent was given a score, from 1 to 15, on his or her knowledge of the COFLU-20. A score from 1 to 7 was considered to indicate poor' knowledge, 8 to 11 indicated 'satisfactory knowledge and 12 to 15 indicated good knowledge. Table 2 below shows the knowledge level of respondents, by age group. Table 2 Age Group Knowledge Level Total Poor Satisfactory Good 18 - 25 33 16 13 62 26 - 34 30 18 | 12 | 60 35 - 44 29 14 12 55 45 - 54 36 16 18 70 55 - 75 17 14 22 53 Total 145 78 77 300 (c) Using Table 2, assist the researcher to calculate the probability that a randomly selected respondent: @) is below 35 years of age and has good knowledge of the COFLU-20 (i) is below 35 years of age or has good knowledge of the COFLU-20 91

Glencoe Algebra 1, Student Edition, 9780079039897, 0079039898, 2018
18th Edition
ISBN:9780079039897
Author:Carter
Publisher:Carter
Chapter10: Statistics
Section10.5: Comparing Sets Of Data
Problem 14PPS

Related questions

Concept explainers
Contingency Table
A contingency table can be defined as the visual representation of the relationship between two or more categorical variables that can be evaluated and registered. It is a categorical version of the scatterplot, which is used to investigate the linear relationship between two variables. A contingency table is indeed a type of frequency distribution table that displays two variables at the same time.
Binomial Distribution
Binomial is an algebraic expression of the sum or the difference of two terms. Before knowing about binomial distribution, we must know about the binomial theorem.
Topic Video
Question
Question 1c
Transcribed Image Text:Each respondent was given a score, from 1 to 15, on his or her knowledge of the COFLU-20. A
score from 1 to 7 was considered to indicate poor' knowledge, 8 to 11 indicated 'satisfactory
knowledge and 12 to 15 indicated good knowledge. Table 2 below shows the knowledge level of
respondents, by age group.
Table 2
Age Group
Knowledge Level
Total
Poor
Satisfactory
Good
18 - 25
33
16
13
62
26 - 34
30
18
| 12 |
60
35 - 44
29
14
12
55
45 - 54
36
16
18
70
55 - 75
17
14
22
53
Total
145
78
77
300
(c) Using Table 2, assist the researcher to calculate the probability that a randomly selected
respondent:
@) is below 35 years of age and has good knowledge of the COFLU-20
(i) is below 35 years of age or has good knowledge of the COFLU-20
91
Expert Solution
This question has been solved!
Explore an expertly crafted, step-by-step solution for a thorough understanding of key concepts.

This is a popular solution!

Trending now
This is a popular solution!

Step by step
Solved in 2 steps with 1 images

Knowledge Booster


Learn more about
Need a deep-dive on the concept behind this application? Look no further. Learn more about this topic, statistics and related others by exploring similar questions and additional content below.Recommended textbooks for you
Glencoe Algebra 1, Student Edition, 9780079039897…
Algebra
ISBN:
9780079039897
Author:
Carter
Publisher:
McGraw Hill
Glencoe Algebra 1, Student Edition, 9780079039897…
Algebra
ISBN:
9780079039897
Author:
Carter
Publisher:
McGraw Hill