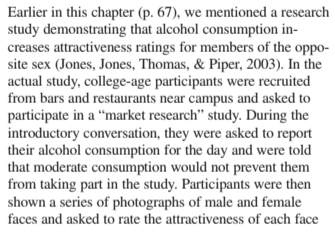
Earlier in this chapter (p. 67), we mentioned a researd study demonstrating that alcohol consumption in- creases attractiveness ratings for members of the oppe site sex (Jones, Jones, Thomas, & Piper, 2003). In the actual study, college-age participants were recruited from bars and restaurants near campus and asked to participate in a “market research" study. During the introductory conversation, they were asked to report their alcohol consumption for the day and were told that moderate consumption would not prevent them from taking part in the study. Participants were then shown a series of photographs of male and female faces and asked to rate the attractiveness of each face
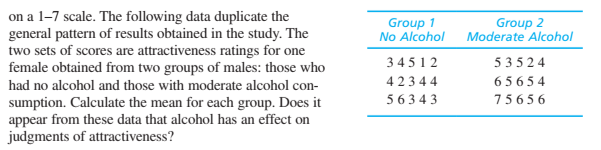
Q: The article "Time Series Analysis for Construction Productivity Experiments" (T. Abdelhamid and J.…
A: a) From the given information, the claim of the problem is the mean time by using video system…
Q: A researcher wants to know whether the acidity of rain (pH) near Houston, Texas, is significantly…
A: In order to determine whether there is significant difference in the pH of rain in Chicago and…
Q: Mr. Acosta, a sociologist, is doing a study to see if there is a relationship between the age of a…
A: The null and alternative hypotheses for the test are: H0: The age and type of movies preferred are…
Q: In the Salsberry (2003) study shared in this weeks module, the researcher presents the following…
A: Chi-square test for “Goodness of fit”:The Chi-square test for “Goodness of fit” is used to test the…
Q: 5) For each scenario listed on the left, determine whether the scenario represents an…
A: 5) Independent samples: Two samples are said to be independent of each other when values of one…
Q: Which of the following research ideas will be best for using a cross- sectional research design? To…
A: Cross sectional study is observational research design involve analysing the data from population at…
Q: Sigall and Ostrove ( 1975) did an experiment to assess whether the physical attractiveness of a…
A: 1] Level of significance α=0.05 2] F (1, 108) = 184.29 3] Attractive photo M = 7.53 4] Unattractive…
Q: In studies examining the effect of humor on interper- sonal attractions, McGee and Shevlin (2009)…
A: (a). Test whether the mean rating of females who read “great sense of humour” is greater than 4 or…
Q: In the book Business Research Methods (5th ed.), Donald R. Cooper and C. William Emory discuss…
A:
Q: A researcher wants to determine if there is a relationship between income earned by siblings and…
A: Experimental study: In a designed experimental study, researchers allocated individuals to a certain…
Q: A group of businessmen are interested in determining if there is a relationship between sales and…
A: Hypothesis testing
Q: The following data represents results from an experiment comparing 3 treatment conditions for the…
A: a) The one-way ANOVA should be conducted here as there are only three groups to compare and no…
Q: nahit Kirakosyan, a consumer analyst collected the following data on the screen sizes of popular…
A: Regression : Simple Linear Regression analysis is used to measure the association or linear…
Q: A suburban hotel derives its revenue from its hotel and restaurant operations. The owners are…
A: Note : Since we only answer up to 3 sub-parts, we’ll answer the first 3. Please resubmit the…
Q: The following data are obtained from a study that seeks to investigate the effects of an…
A: Hello! As you have posted more than 3 sub parts, we are answering the first 3 sub-parts. In case…
Q: Determine whether each of the following studies described is observational or an experiment. If the…
A: In a study of the effects of magnets on back pain, some participants were treated with magnets while…
Q: Mr. Acosta, a sociologist, is doing a study to see if there is a relationship between the age of a…
A:
Q: Identify the appropriate hypothesis test for each of the following research situations. A researcher…
A: It is appropriate to use a two-sample independent t-test because the samples here, 8-year-old and…
Q: a.) What sort of research design is used in this study? How do you know? b.) What values go in the…
A: Hello. Since your question has multiple sub-parts, we will solve first three sub-parts for you. If…
Q: A paper investigated the driving behavior of teenagers by observing their vehicles as they left a…
A:
Q: Mr. James, president of Daniel-James Financial Services, believes that there is a relationship…
A: y is the (dependent or response) variable And x is the (independent or explanatory) variable.…
Q: A multinational corporation is conducting a study to see how its employees in five different…
A: The numbers of employees who choose each of the three gifts (G1 to G3) in each of the five countries…
Q: In a classic research study, Shrauger (1972) examined the effect of an audience on the performance…
A: Given information: The data represents the values of the dependent variable number of errors made by…
Q: The data below are from an independent-measures experiment comparing three different treatment…
A: Given K=3 no of treatment n=12 no of observation
Q: A developmental psychologist is studying bonding between healthy newborn babies and immediate family…
A: It is given that the number of categories (k) is 3.
Q: The paper "A Cross-National Relationship Between Sugar Consumption and Major Depression?"…
A: Given Data : X = Sugar Consumption Y = Depression Rate 150 2.3 300 3 350 4.4 375 5 390…
Q: An online clothing retailer is testing a new e-mail campaign by sending one version of the e-mail…
A: Note: Since you have posted questions with multiple subparts we will solve the first three questions…
Q: In a recent Super Bowl, a TV network predicted that 71 % of the audience would express an interest…
A:
Q: QUESTION 11 Are beer (B), wine (W), and liquor (L) equally favored by Americans as the alcoholic…
A: Obtain the value of the test statistic. The value of the test statistic is obtained below as…
Q: A researcher wants to know whether the acidity of rain (pH) near Houston, Texas, is significantly…
A:
Q: ) A marketing survey of consumers' soft-drink preferences collected the following data: • 75 liked…
A: Let us denote:C=cola, G=ginger ale, S=spring waterGiven that:n(C)=75, n(G)=65,…
Q: In low-speed crash tests of five cars, the repair costs were computed for a factory authorized…
A: Null hypothesis: H0: µd≤0. That is, the repair costs for independent workshop is not lower than…
Q: As mentioned in Chapters 2 and 3 (pp. 38 and 81) Steven Schmidt (1994) reported a series of studies…
A: Given information n = 16 SS = 135 MD = 3.25 Null Hypothesis: - Humour has no significant effect on…
Q: Suppose the marketing research firm would like to examine if the social networking site that a…
A: The data shows the sample of 369 social network users were asked which site they primarily visited.
Q: The data below are from an independent-measures experiment comparing three different treatment…
A: Given Treatment 1 Treatment 2 Treatment 3 0 1 4 0 4 3 0 1 6 2 0 3
Q: The marketing department of ABC Ltd is interested in assessing whether those people who currently…
A: The hypothesis is, Null hypothesis: H0: There is no association between customers’ purchasing…
Q: When testing (at the 5% level of significance) whether the vehicle-ownership distribution in this…
A: Test is that whether the vehicle-ownership distribution in this community differs from that of the…
Q: Recently, researchers have begun to focus on the relationship between potentially toxic…
A: (A) The hypotheses are written as follows: Null hypothesis: There is no statistically significant…
Q: In the book Business Research Methods (5th ed.), Donald R. Cooper and C. William Emory discuss…
A:
Q: A suburban hotel derives its revenue from its hotel and restaurant operations. The owners are…
A:
Q: The following data were obtained from an independent-measures research study comparing three…
A: Statistical hypothesis testing is an important method in inferential statistics. It is used to test…
Q: ased on a survey of a random sample of 900 adults in the United States, a journalist reports that A…
A:
Q: For which of these research designs would you start with a group of people and follow them over time…
A: For which of these research designs would you start with a group of people and follow them over time…
Q: The following data were obtained from an independent-measures study comparing three treatment…
A: Tukey's HSD test is used when at least one group differs from the rest of the groups. The test…
Q: (a) What is the level of significance? State the null and alternate hypotheses. H0: Age and movie…
A: As per our guidelines,we are allowed to answer first three sub-parts only. Thanks Given Data :…
Q: Mr. Acosta, a sociologist, is doing a study to see if there is a relationship between the age of a…
A: Provided information is, 18-23 yr 24-29 yr 30-35 yr Row Drama 7 13 14 34…
Q: Following is the rating of marketing aggressivity (X) and sales performance (Y) of 8 sales staffs in…
A: Here we'll define null hypothesis and alternative hypothesis for the given statement and data.
Q: Prior to assessment of the outcome, the researchers did a manipulation check. Members of Groups 1…
A: Q1)The calculate F-statistic = 184.29Critical f-value at df(1,108) = 3.929Excel formula used:…
Q: Mr. Acosta, a sociologist, is doing a study to see if there is a relationship between the age of a…
A: Given that, Mr. Acosta, a sociologist, is doing a study to see if there is a relationship between…
Please help me solve this? Thanks
Trending now
This is a popular solution!
Step by step
Solved in 3 steps with 3 images
- In the Salsberry (2003) study shared in this weeks module, the researcher presents the following results of the statistical analysis: "With respect to family configuration, 20% of the children enrolled in Medicaid, 29% of the uninsured children, and 44% of the privately insured children were in families where the adults were in a “partnered relationship”, [χ2 (2,N = 392) = 21.95; P = .0001]" What type of analysis does this statement reflect?Based on a survey of 12,344 U.S. college students and 6,729 Canadian college students, Kuo, Adlaf, Lee, Gliksman, Demers, and Wechsler (2002) report that alcohol use is more common among Canadian than U.S. students, but heavy drinking (five or more drinks in a row for males, four or more for females) is significantly higher among U.S. students than Canadian students. Is this an example of a survey research design?The following data are taken from an experiment in which the subjects were tested for motion sickness. Thesubjects were randomly assigned to either the control group which was given a placebo or the experimentalgroup which was given the drug Astemizole and observed on an ocean voyage. The same subjects were thenswitched and those that had the placebo were now given the drug, and those that had the drug were nowgiven a placebo and observed on a new ocean voyage taking the same course. The results are the number ofhead movements that the subjects could endure without becoming nauseous. Use α = 0.05 to test the claimthat Astemizole is effective, i.e. it takes a larger number of head movements before the subject getsnauseous.Control 19 45 36 42 38 31 30 40 41 35Drug 20 55 36 45 40 32 41 38 44 29 1) State the hypotheses and identify the claim. Group 1 is the Control group. 2)Find the test statistic and Find the p-value. 3)Make the decision and Summarize the results.
- In a study examining the effect of humor on interpersonal attractions, McGee and Shevlin (2009) foundthat a man’s sense of humor had a significant effect onhow he was perceived by women. In the study, femalecollege students were given brief descriptions of a potential romantic partner and then rated the attractivenessof the male on a scale from 1 (low) to 7 (high). Thefictitious male was described positively as being single,ambitious, and having good job prospects. In one condition, the description also said that he had a great senseof humor. The results showed that the description wasrated significantly higher when “a sense of humor” wasincluded. To further examine this effect, a researcherselected a sample of n = 16 college males and askedthem to read a brief description of a female and thenrate the attractiveness of the woman in the description.The description had been used in previous research butwas modified by adding a statement describing a goodsense of humor. Based on the…A paper investigated the driving behavior of teenagers by observing their vehicles as they left a high school parking lot and then again at a site approximately 1 2 mile from the school. Assume that it is reasonable to regard the teen drivers in this study as representative of the population of teen drivers. MaleDriver FemaleDriver 1.3 -0.3 1.3 0.6 0.9 1.1 2.1 0.7 0.7 1.1 1.3 1.2 3 0.1 1.3 0.9 0.6 0.5 2.1 0.5 (a) Use a .01 level of significance for any hypothesis tests. Data consistent with summary quantities appearing in the paper are given in the table. The measurements represent the difference between the observed vehicle speed and the posted speed limit (in miles per hour) for a sample of male teenage drivers and a sample of female teenage drivers. (Use ?males − ?females. Round your test statistic to two decimal places. Round your degrees of freedom down to the nearest whole number. Round your p-value to three decimal places.) t = df =…A paper investigated the driving behavior of teenagers by observing their vehicles as they left a high school parking lot and then again at a site approximately 1 2 mile from the school. Assume that it is reasonable to regard the teen drivers in this study as representative of the population of teen drivers. MaleDriver FemaleDriver 1.4 -0.2 1.2 0.5 0.9 1.1 2.1 0.7 0.7 1.1 1.3 1.2 3 0.1 1.3 0.9 0.6 0.5 2.1 0.5 (a) Use a .01 level of significance for any hypothesis tests. Data consistent with summary quantities appearing in the paper are given in the table. The measurements represent the difference between the observed vehicle speed and the posted speed limit (in miles per hour) for a sample of male teenage drivers and a sample of female teenage drivers. (Use ?males − ?females. Round your test statistic to two decimal places. Round your degrees of freedom down to the nearest whole number. Round your p-value to three decimal places.) t = df =…
- Aronson and Mills (1959) conducted an experiment to see whether people's liking for a group is influenced by the severity of initiation. They reasoned that when people willingly undergo a severe initiation to become members of a group, they are motivated to think that the group membership must be worthwhile. Otherwise, they would experience cognitive dissonance: Why put up with severe initiation for the sake of a group membership that is worthless? In their experiment, participants were randomly assigned to one of three treatment groups: Group 1 (control) had no initiation. Group 2 (mild) had a mildly embarrassing initiation (reading words related to sex out loud). Group 3 (severe) had a severely embarrassing initiation (reading sexually explicit words and obscene words out loud). After the initiation, each person listened to a standard tape-recorded discussion among the group that they would now supposedly be invited to join; this was made up made to be as dull and banal as possible.…The following data are obtained from a study that seeks to investigate theeffects of an intervention program and the extent of their physical disability on their reading, math and IQ scores. The students who had been recipients of an intervention program are in the treatment group and while those who are not are in the control group. Questions:1. Is there a significant difference in the math, reading and IQ scores ofstudents in the treatment and controlgroups?2. Is the intervention program effective?3. Is there a significant difference in the math, reading and IQ scores ofstudentswhen they are grouped according to the extent of their physicaldisability?4. Isthereasignificantinteractionbetweentreatmentandextentofdisabilityonthe students’ reading, math and IQscores?A sample of 250 high school students were asked, “If you had $1000 to contribute to one kind of charitableorganization, which type of organization would you choose? Here is a two-way table that displays data ongender and response to this question. Which of the following conclusions seems to be supported by the data?(a) Most of the females who chose a health organization would have chosen an environmental organizationas their second choice, had they been asked.(b) There is no association between gender and choice of organization.(c) The proportion of males who said they would contribute to an environmental organization is higher thanthe proportion of females who said they would contribute such an organization.(d) None of the students surveyed said they would contribute to religious organizations.(e) The marginal relative frequencies of organization are 140, 110.
- The marketing department of ABC Ltd is interested in assessing whether those people who currently buy cars from a rival do so because they view ABC’s cars as being of poor quality. In carrying out a survey, the marketing department asked 200 people two questions. Firstly, have you purchased a car from ABC in the last month? Secondly, which of the following best describes your view of the quality of cars sold by ABC? The responses to these questions are shown in the Table below. Is there evidence of an association between customers’ purchasing behaviour and their perception of the quality of cars sold by ABC Ltd? Explain your results in terms that would be comprehensible to a manager with little knowledge of statistics.In the book Business Research Methods (5th ed.), Donald R. Cooper and C. William Emory discuss studying the relationship between on-the-job accidents and smoking. Cooper and Emory describe the study as follows: Suppose a manager implementing a smoke-free workplace policy is interested in whether smoking affects worker accidents. Since the company has complete reports of on-the-job accidents, she draws a sample of names of workers who were involved in accidents during the last year. A similar sample from among workers who had no reported accidents in the last year is drawn. She interviews members of both groups to determine if they are smokers or not. The sample results are given in the following table. On-the-Job Accident Smoker Yes No Row Total Heavy 12 5 17 Moderate 9 10 19 Nonsmoker 13 17 30 Column total 34 32 66 Expected counts are below observed counts Accident No Accident Total Heavy 12 5 17 8.76 8.24…Consider the following table of results from a survey: Did the ad make a favorable, an unfavorable, or no impression on buying the item. (give explanation)?