
MATLAB: An Introduction with Applications
6th Edition
ISBN: 9781119256830
Author: Amos Gilat
Publisher: John Wiley & Sons Inc
expand_more
expand_more
format_list_bulleted
Topic Video
Question

Transcribed Image Text:
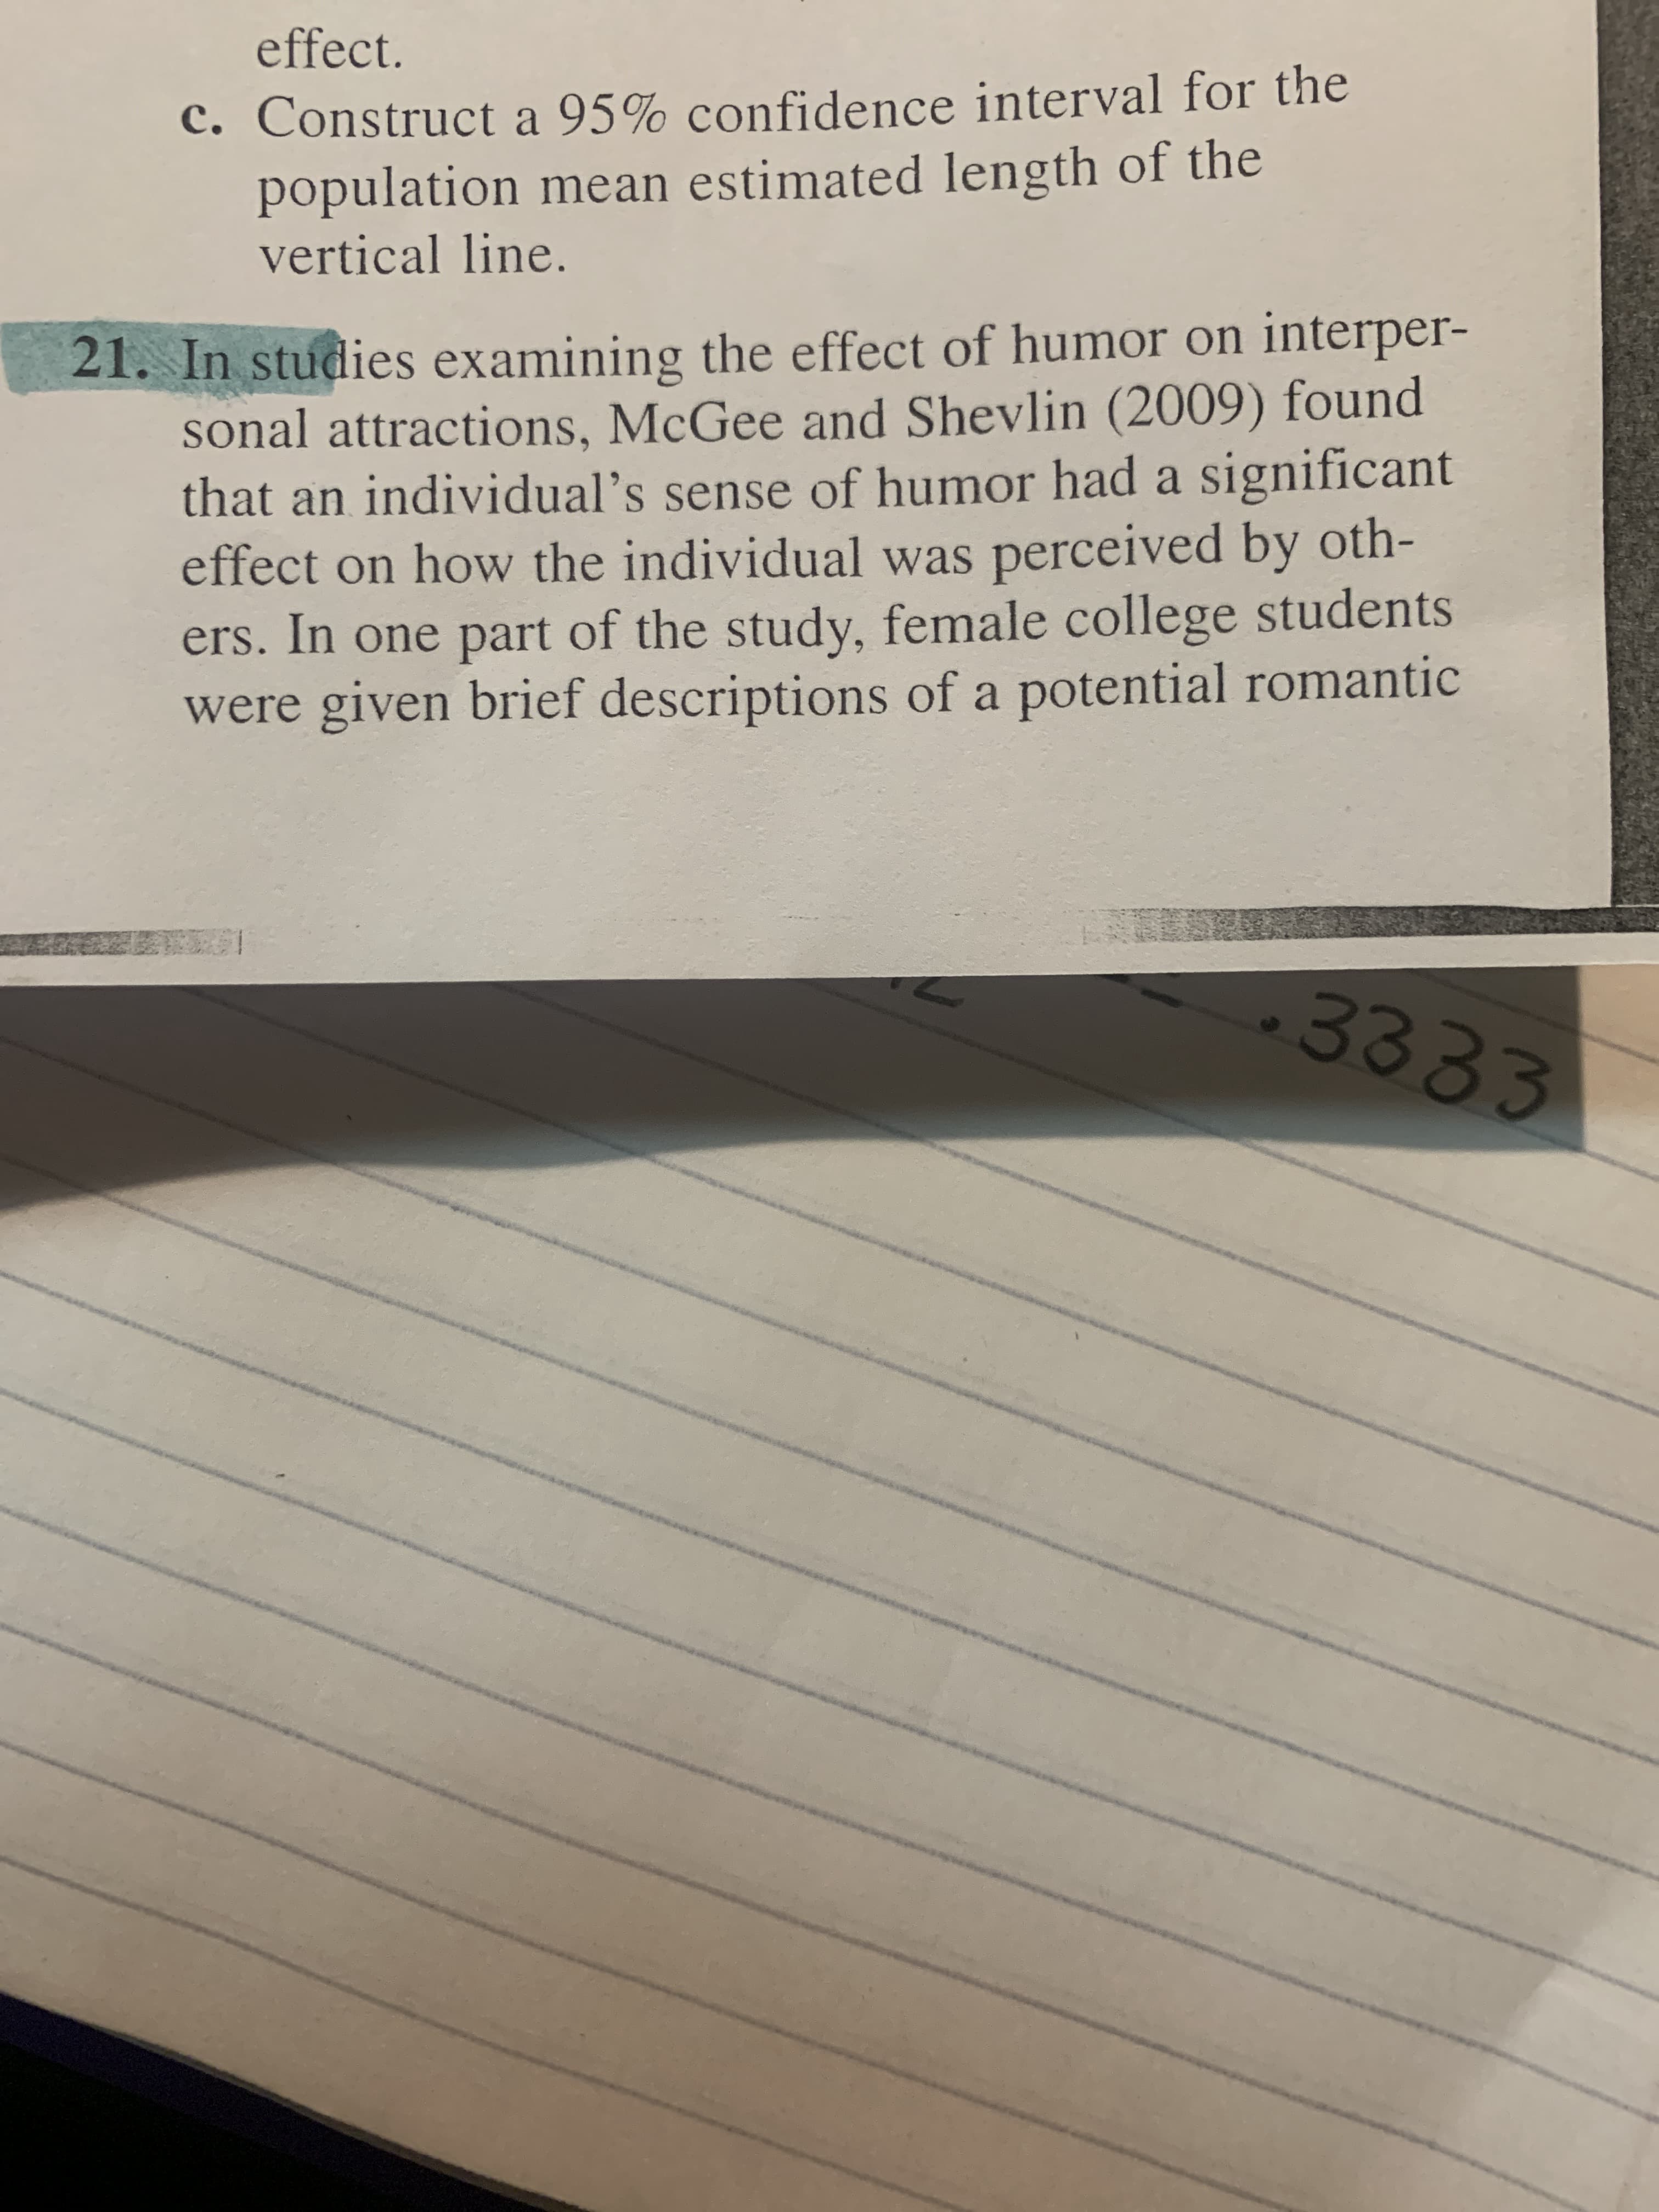
In studies examining the effect of humor on interper-
sonal attractions, McGee and Shevlin (2009) found
that an individual's sense of humor had a significant
effect on how the individual was perceived by oth-
ers. In one part of the study, female college students
were given brief descriptions of a potential romantic

Expert Solution

This question has been solved!
Explore an expertly crafted, step-by-step solution for a thorough understanding of key concepts.
Step by stepSolved in 2 steps with 4 images

Knowledge Booster
Learn more about
Need a deep-dive on the concept behind this application? Look no further. Learn more about this topic, statistics and related others by exploring similar questions and additional content below.Similar questions
- According to the National Institute on Alcohol Abuse and Alcoholism (NIAAA), and the National Institutes of Health (NIH), 42% of college students nationwide engage in “binge drinking” behavior, having 5 or more drinks in one occasion during the past two weeks. A college president wonders if the proportion of students enrolled at her college that binge drink is actually different than the national proportion. In a commissioned study, 364 students are selected randomly from a list of all students enrolled at the college. Of these, 136 admitted to having engaged in binge drinking. The same college president is more interested in testing her suspicion that the proportion of students at her college that binge drink is different than the national proportion of .37. Use the statistic provided for her college above for your test. A. Define the null and alternative hypotheses to test this claim. B. By hand, calculate the test statistic for this test. C. Use…arrow_forward3arrow_forwardResearchers investigate how the presence of cell phones influence the quality of human interaction. Subjects are randomly selected from a population and divided into an experimental group that is asked to leave their phones in the front of the room and a control group that are not asked to leave their cell phones at the front of the room. Subjects are left alone for 10 minutes and then asked to take a survey designed to measure quality of interactions they had with others in the experiment. What statistical test is appropriate?arrow_forward
- A warehouse manager wants to know if there is an association between the shift worked and being on time for work. To investigate, he selects a random sample of 70 workers and classifies each one according to the shift they worked most recently and whether they were on time for work. He was unable to classify a substantial number of people as being on time, so he classified those individuals as unknown. The data are displayed in the table. The manager would like to know if these data provide convincing evidence of an association between the shift worked and being on time in the large population of all workers at this warehouse. The random and 10% conditions are met. Is the Large Counts condition met? Yes, the smallest expected count is 5, so all expected counts are at least 5. Yes, the smallest expected count is 8.54, so all expected counts are at least 5. No, the smallest expected count is 2.56, so the expected counts are not all at least 5. No, the smallest expected count is…arrow_forwardA case-control (or retrospective) study was conducted to investigate a relationship between the colors of helmets worn by motorcycle drivers and whether they are injured or killed in a crash. Results are given in the accompanying table. Using a 0.05 significance level, test the claim that injuries are independent of helmet color. Black; White; Yellow; Red; Blue Controls (not injured) 500; 355; 32; 173; 79 Cases (injured or killed) 220; 115; 9; 71; 38arrow_forwardIn an interview for a job, the interviewer says that the average annual income of the company's 16 employees is $73,610. The actual annual incomes of the 16 employees are shown below. Which measure of central tendency would be most informative to the potential employee? OOO O O median O mode O mean Orange $12,500 $12,500 $16,430 $17,305 $17,408 $18,980 $20,432 $24,540 $25,676 $28,906 $28,956 $32,654 $94,024 $98,213 $250,921 $478,320arrow_forward
- A study prospectively examined whether sleep-disordered breathing was associated with an increased risk of death from any cause in a cohort of 600 adults participating in the Sleep Heart Health Study. Study participants were classified into four groups depending on the extent of their sleep-disordered breathing (none, mild, moderate, or severe). The counts of deaths over the course of the study are reported for each group in the following two-way table. Mild Severe 100 Death No Death Total None 40 100 140 40 100 140 Moderate 20 100 120 Total 200 400 600 100 200 We want to know whether the study findings give evidence of a significant difference of the number of deaths between the different groups. Set up the alternative hypothesis (H, : The distribution of the categorical variable is not as given by the null hypothesis (lack of fit) At least ones of the means is different from the others O The two categorical variables are dependent The distribution of the categorical variable is not…arrow_forwardA study prospectively examined whether sleep-disordered breathing was associated with an increased risk of death from any cause in a cohort of 600 adults participating in the Sleep Heart Health Study. Study participants were classified into four groups depending on the extent of their sleep-disordered breathing (none, mild, moderate, or severe). The counts of deaths over the course of the study are reported for each group in the following two-way table. Death No Death Total None 40 100 140 Mild 40 100 140 Moderate 20 100 120 Severe 100 100 200 Total 200 400 600 We want to know whether the study findings give evidence of a significant difference of the number of deaths between the different groups. The observed test statistic is 3.610 42.857 5.476 8.075arrow_forwardAccording to the National Institute on Alcohol Abuse and Alcoholism (NIAAA), and the National Institutes of Health (NIH), 42% of college students nationwide engage in “binge drinking” behavior, having 5 or more drinks in one occasion during the past two weeks. A college president wonders if the proportion of students enrolled at her college that binge drink is actually different than the national proportion. In a commissioned study, 364 students are selected randomly from a list of all students enrolled at the college. Of these, 136 admitted to having engaged in binge drinking. Calculate the statistic for this sample. Calculate the standard error for this sample. Verify that we can use a normal distribution for this sample. By hand calculate a 90% confidence interval for the proportion of all students at this college that engage in binge drinking. Show all work. Interpret the results of your confidence interval in the context of the…arrow_forward
- Hotel Managers' Personalities. Successful hotel managers must have personality characteristics often thought of as feminine (such as "compassionate") as well as those often thought of as masculine (such as "forceful"). The Bern Sex-Role Inventory (BSRI) is a personality test that gives separate ratings for female and male stereotypes, both on a scale of 1 to 7. A sample of 148 male general managers of three-star and four-star hotels had mean BSRI femininity score y = 5.29 The mean score for the general male population is μ = 5.19. Do hotel managers, on the average, differ significantly in femininity score from men in general? Assume that the standard deviation of scores in the population of all male hotel managers is the same as the σ = 0.78 for the adult male population. (a) State null and alternative hypotheses in terms of the mean femininity score μ for male hotel managers. (b) Find the z test statistic. (c) What is the P-value for your z? What do you conclude about male hotel…arrow_forwardStore Window Creativity and Shopper Behavior. Do more creative store-window displays affect shopper behavior? Six main-street retailers selling everyday fashion items were used in the study. Pretests with shoppers showed the six stores to be comparable on brands and consumer perceptions of value for the money. Three of the retailers had more creative windows, in terms of displaying items in a more innovative and artistic manner versus the less creative windows, which had a more concrete focus on the items on display. All display windows were of similar dimensions. Observers, in close proximity but out of sight of shoppers, watched their behavior as they passed the display windows, and for each shopper the observers recorded whether the shopper looked at the window or entered the store. A total of 863 shoppers passed the more creative windows and 971 passed the less creative windows. The study found that a higher percentage of shoppers looked at and entered the stores with the more…arrow_forwardIn Born Together – Reared Apart: The Landmark Minnesota Twin Study (2012), Nancy Segal discusses the efforts of research psychologists at the University of Minnesota to understand similarities and differences between twins by studying sets of twins who were raised separately. Below are critical reading SAT scores for several pairs of identical twins (twins who share all of their genes), one of whom was raised in a family with no other children (no siblings) and one of whom was raised in a family with other children (with siblings). What is the mean difference between the critical reading SAT scores for the twins raised with no siblings and the twins raised with siblings? Provide a 90% confidence interval estimate of the mean difference between the critical reading SAT scores for the twins raised with no siblings and the twins raised with siblings Conduct a hypothesis test of equality of the critical reading SAT scores for the twins raised with no siblings and the twins raised with…arrow_forward
arrow_back_ios
arrow_forward_ios
Recommended textbooks for you
- MATLAB: An Introduction with ApplicationsStatisticsISBN:9781119256830Author:Amos GilatPublisher:John Wiley & Sons IncProbability and Statistics for Engineering and th...StatisticsISBN:9781305251809Author:Jay L. DevorePublisher:Cengage LearningStatistics for The Behavioral Sciences (MindTap C...StatisticsISBN:9781305504912Author:Frederick J Gravetter, Larry B. WallnauPublisher:Cengage Learning
- Elementary Statistics: Picturing the World (7th E...StatisticsISBN:9780134683416Author:Ron Larson, Betsy FarberPublisher:PEARSONThe Basic Practice of StatisticsStatisticsISBN:9781319042578Author:David S. Moore, William I. Notz, Michael A. FlignerPublisher:W. H. FreemanIntroduction to the Practice of StatisticsStatisticsISBN:9781319013387Author:David S. Moore, George P. McCabe, Bruce A. CraigPublisher:W. H. Freeman

MATLAB: An Introduction with Applications
Statistics
ISBN:9781119256830
Author:Amos Gilat
Publisher:John Wiley & Sons Inc

Probability and Statistics for Engineering and th...
Statistics
ISBN:9781305251809
Author:Jay L. Devore
Publisher:Cengage Learning

Statistics for The Behavioral Sciences (MindTap C...
Statistics
ISBN:9781305504912
Author:Frederick J Gravetter, Larry B. Wallnau
Publisher:Cengage Learning

Elementary Statistics: Picturing the World (7th E...
Statistics
ISBN:9780134683416
Author:Ron Larson, Betsy Farber
Publisher:PEARSON

The Basic Practice of Statistics
Statistics
ISBN:9781319042578
Author:David S. Moore, William I. Notz, Michael A. Fligner
Publisher:W. H. Freeman

Introduction to the Practice of Statistics
Statistics
ISBN:9781319013387
Author:David S. Moore, George P. McCabe, Bruce A. Craig
Publisher:W. H. Freeman