#3 PRICE (Dollars per tonne) cengage.com/static/nb/ui/evo/index.html?elSBN=9780357302934&snapshotld=D2741525&id3D1376796971& E CENGAGE MINDTAP Q Search thisC News Analysis: Nailing Down Metal Tariffs THIR A JA 15 ndu BILLS Consider a hypothetical example of trade in aluminum between the United States and China. For simplicity, assume that China is the only source of U.S. aluminum imports. The following graph shows the U.S. market for aluminum. Note that in the absence of any trade, the market price for aluminum in the United States is $500 per tonne, and the equilibrium quantity is 50 million tonnes per month. Use the green area (triangle symbol) to show U.S. consumer surplus under free trade with China, and use the purple area (diamond symbol) to show U.S. producer surplus under free trade with China. 0000 Domestic Demand Domestic Supply 006 Consumer Surplus 008 Producer Surplus 009 Free Trade Price 1. 06 20 08 09 QUANTITY OF ALUMINUM (Millions of tonnes per month) MacBook Air DOO F4 114 F8 F10 & 24 4. 5 7. 6 H B. W alt command option pubwu * 00 LU %#3 lapshotld%3D2741525&id%3D1376796971& CENGAGE MINDTAP Q Sea News Analysis: Nailing Down Metal Tariffs Use the previous graph to complete the first row of the following table by indicating the quantity of aluminum supplied by U.S. producers, demanded by U.S. consumers, and imported from China under free trade. Quantity Demanded by U.S. Quantity Supplied by U.S. Producers Consumers Quantity Imported from China (Millions of tonnes of aluminum per (Millions of tonnes of aluminum per (Millions of tonnes of aluminum per month) month) month) Free Trade Trade with Tariff Suppose American aluminum manufacturers convince the U.S. government that Chinese firms are selling aluminum in the U.S. market at well below the cost of producing the aluminum, a practice known as dumping. In response to the accusations, the U.S. government puts a tariff of $200 per tonne on aluminum from China. The tariff increases the price of aluminum from $200 to $ per tonne. Complete the second row of the previous table by indicating the quantity of aluminum supplied by U.S. producers, demanded by U.S. consumers, and imported from China in the presence of a $200-per-tonne tariff. On the following graph, use the black line (cross symbol) to indicate the domestic price of aluminum in the presence of a $200-per-tonne tariff. Then use the green area (triangle symbol) to shade the area that represents consumer surplus under the tariff, and use the purple area (diamond symbol) to shade the area that represents producer surplus under the tariff. Finally, use the grey rectangle (star symbols) to show the revenue that the U.S. government collects as a result of the tariff, and use the tan triangles (dash symbols) to show the deadweight loss (DWL) from the imposition of the tariff. Note: There are two DWL triangles. Plot the right-most DWL triangle first, then plot the left-most DWL triangle after that. Plotting the DWL triangles out of order may cause your answer to be graded incorrectly. DamesticDemand Domestic Supply MacBook Air 02 F3 114 F8 F12 F10 F2 F5 F4 & $4 4. %23 9. 6 Y R. B. W alt
#3 PRICE (Dollars per tonne) cengage.com/static/nb/ui/evo/index.html?elSBN=9780357302934&snapshotld=D2741525&id3D1376796971& E CENGAGE MINDTAP Q Search thisC News Analysis: Nailing Down Metal Tariffs THIR A JA 15 ndu BILLS Consider a hypothetical example of trade in aluminum between the United States and China. For simplicity, assume that China is the only source of U.S. aluminum imports. The following graph shows the U.S. market for aluminum. Note that in the absence of any trade, the market price for aluminum in the United States is $500 per tonne, and the equilibrium quantity is 50 million tonnes per month. Use the green area (triangle symbol) to show U.S. consumer surplus under free trade with China, and use the purple area (diamond symbol) to show U.S. producer surplus under free trade with China. 0000 Domestic Demand Domestic Supply 006 Consumer Surplus 008 Producer Surplus 009 Free Trade Price 1. 06 20 08 09 QUANTITY OF ALUMINUM (Millions of tonnes per month) MacBook Air DOO F4 114 F8 F10 & 24 4. 5 7. 6 H B. W alt command option pubwu * 00 LU %#3 lapshotld%3D2741525&id%3D1376796971& CENGAGE MINDTAP Q Sea News Analysis: Nailing Down Metal Tariffs Use the previous graph to complete the first row of the following table by indicating the quantity of aluminum supplied by U.S. producers, demanded by U.S. consumers, and imported from China under free trade. Quantity Demanded by U.S. Quantity Supplied by U.S. Producers Consumers Quantity Imported from China (Millions of tonnes of aluminum per (Millions of tonnes of aluminum per (Millions of tonnes of aluminum per month) month) month) Free Trade Trade with Tariff Suppose American aluminum manufacturers convince the U.S. government that Chinese firms are selling aluminum in the U.S. market at well below the cost of producing the aluminum, a practice known as dumping. In response to the accusations, the U.S. government puts a tariff of $200 per tonne on aluminum from China. The tariff increases the price of aluminum from $200 to $ per tonne. Complete the second row of the previous table by indicating the quantity of aluminum supplied by U.S. producers, demanded by U.S. consumers, and imported from China in the presence of a $200-per-tonne tariff. On the following graph, use the black line (cross symbol) to indicate the domestic price of aluminum in the presence of a $200-per-tonne tariff. Then use the green area (triangle symbol) to shade the area that represents consumer surplus under the tariff, and use the purple area (diamond symbol) to shade the area that represents producer surplus under the tariff. Finally, use the grey rectangle (star symbols) to show the revenue that the U.S. government collects as a result of the tariff, and use the tan triangles (dash symbols) to show the deadweight loss (DWL) from the imposition of the tariff. Note: There are two DWL triangles. Plot the right-most DWL triangle first, then plot the left-most DWL triangle after that. Plotting the DWL triangles out of order may cause your answer to be graded incorrectly. DamesticDemand Domestic Supply MacBook Air 02 F3 114 F8 F12 F10 F2 F5 F4 & $4 4. %23 9. 6 Y R. B. W alt

Chapter1: Making Economics Decisions
Section: Chapter Questions
Problem 1QTC

Related questions
Question
100%
Transcribed Image Text:#3
PRICE (Dollars per tonne)
cengage.com/static/nb/ui/evo/index.html?elSBN=9780357302934&snapshotld=D2741525&id3D1376796971&
E CENGAGE MINDTAP
Q Search thisC
News Analysis: Nailing Down Metal Tariffs
THIR A JA 15 ndu BILLS
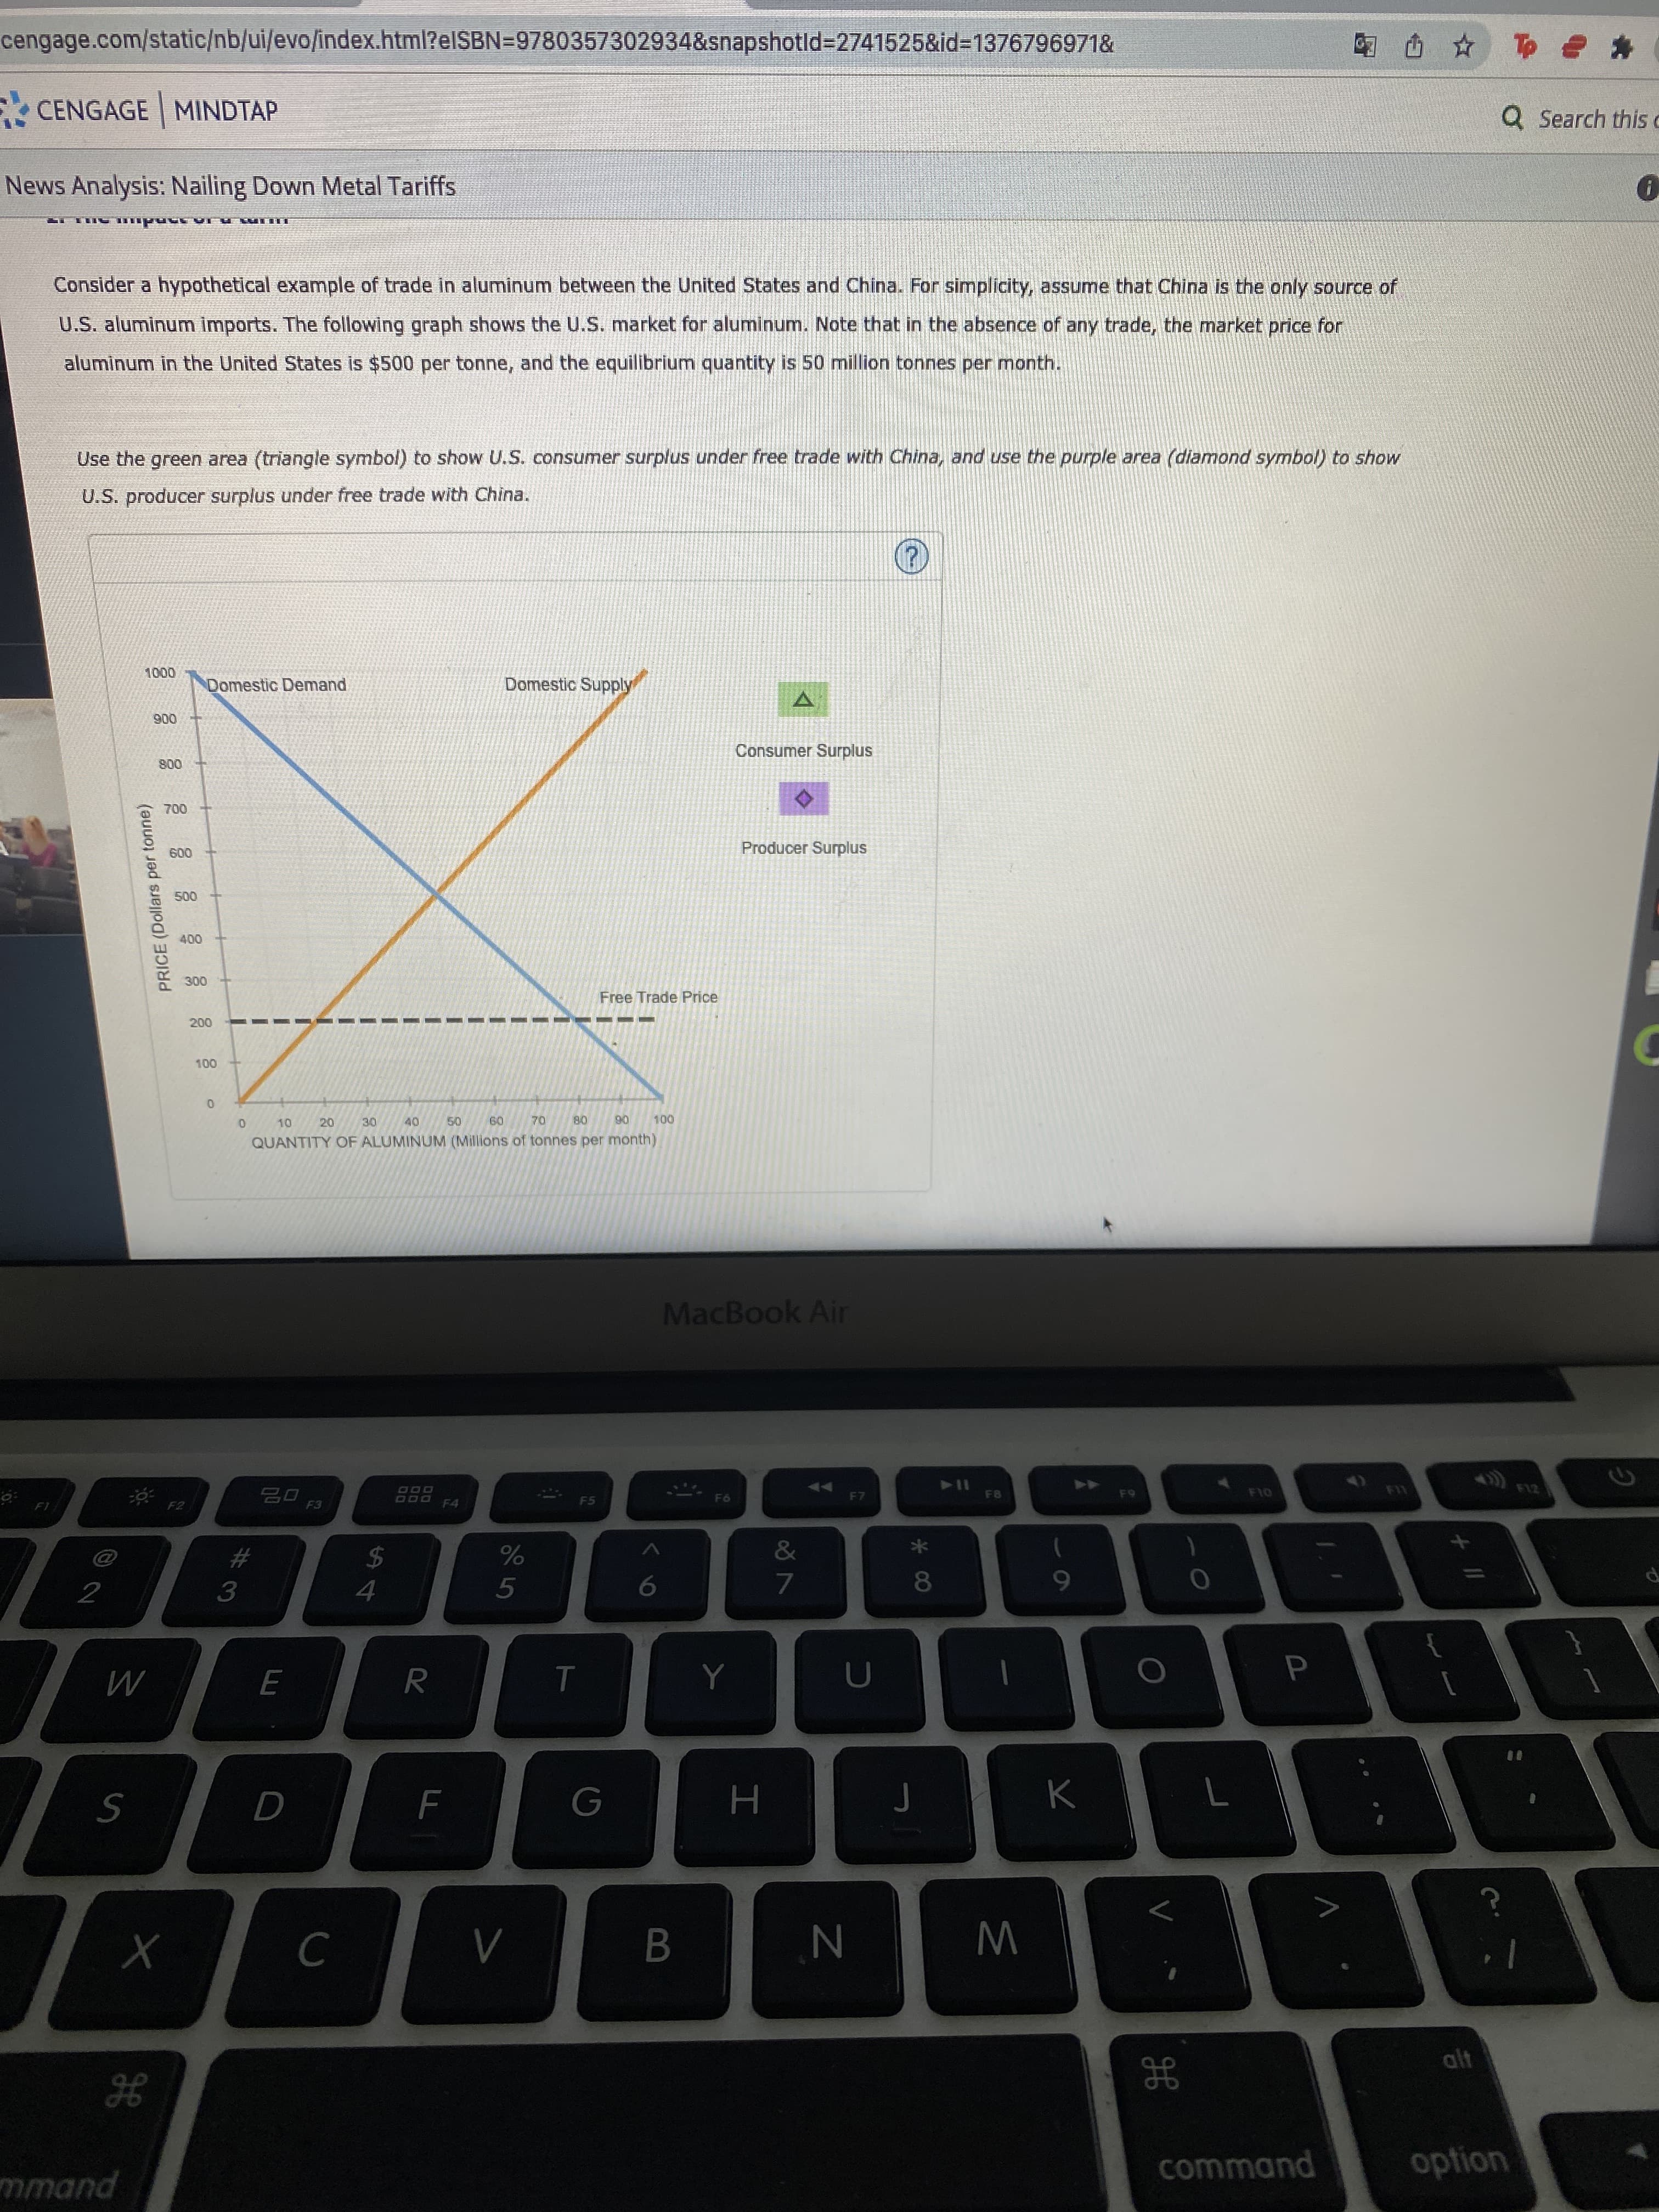
Consider a hypothetical example of trade in aluminum between the United States and China. For simplicity, assume that China is the only source of
U.S. aluminum imports. The following graph shows the U.S. market for aluminum. Note that in the absence of any trade, the market price for
aluminum in the United States is $500 per tonne, and the equilibrium quantity is 50 million tonnes per month.
Use the green area (triangle symbol) to show U.S. consumer surplus under free trade with China, and use the purple area (diamond symbol) to show
U.S. producer surplus under free trade with China.
0000
Domestic Demand
Domestic Supply
006
Consumer Surplus
008
Producer Surplus
009
Free Trade Price
1.
06
20
08
09
QUANTITY OF ALUMINUM (Millions of tonnes per month)
MacBook Air
DOO
F4
114
F8
F10
&
24
4.
5
7.
6
H
B.
W
alt
command
option
pubwu
Transcribed Image Text:* 00
LU
%#3
lapshotld%3D2741525&id%3D1376796971&
CENGAGE MINDTAP
Q Sea
News Analysis: Nailing Down Metal Tariffs
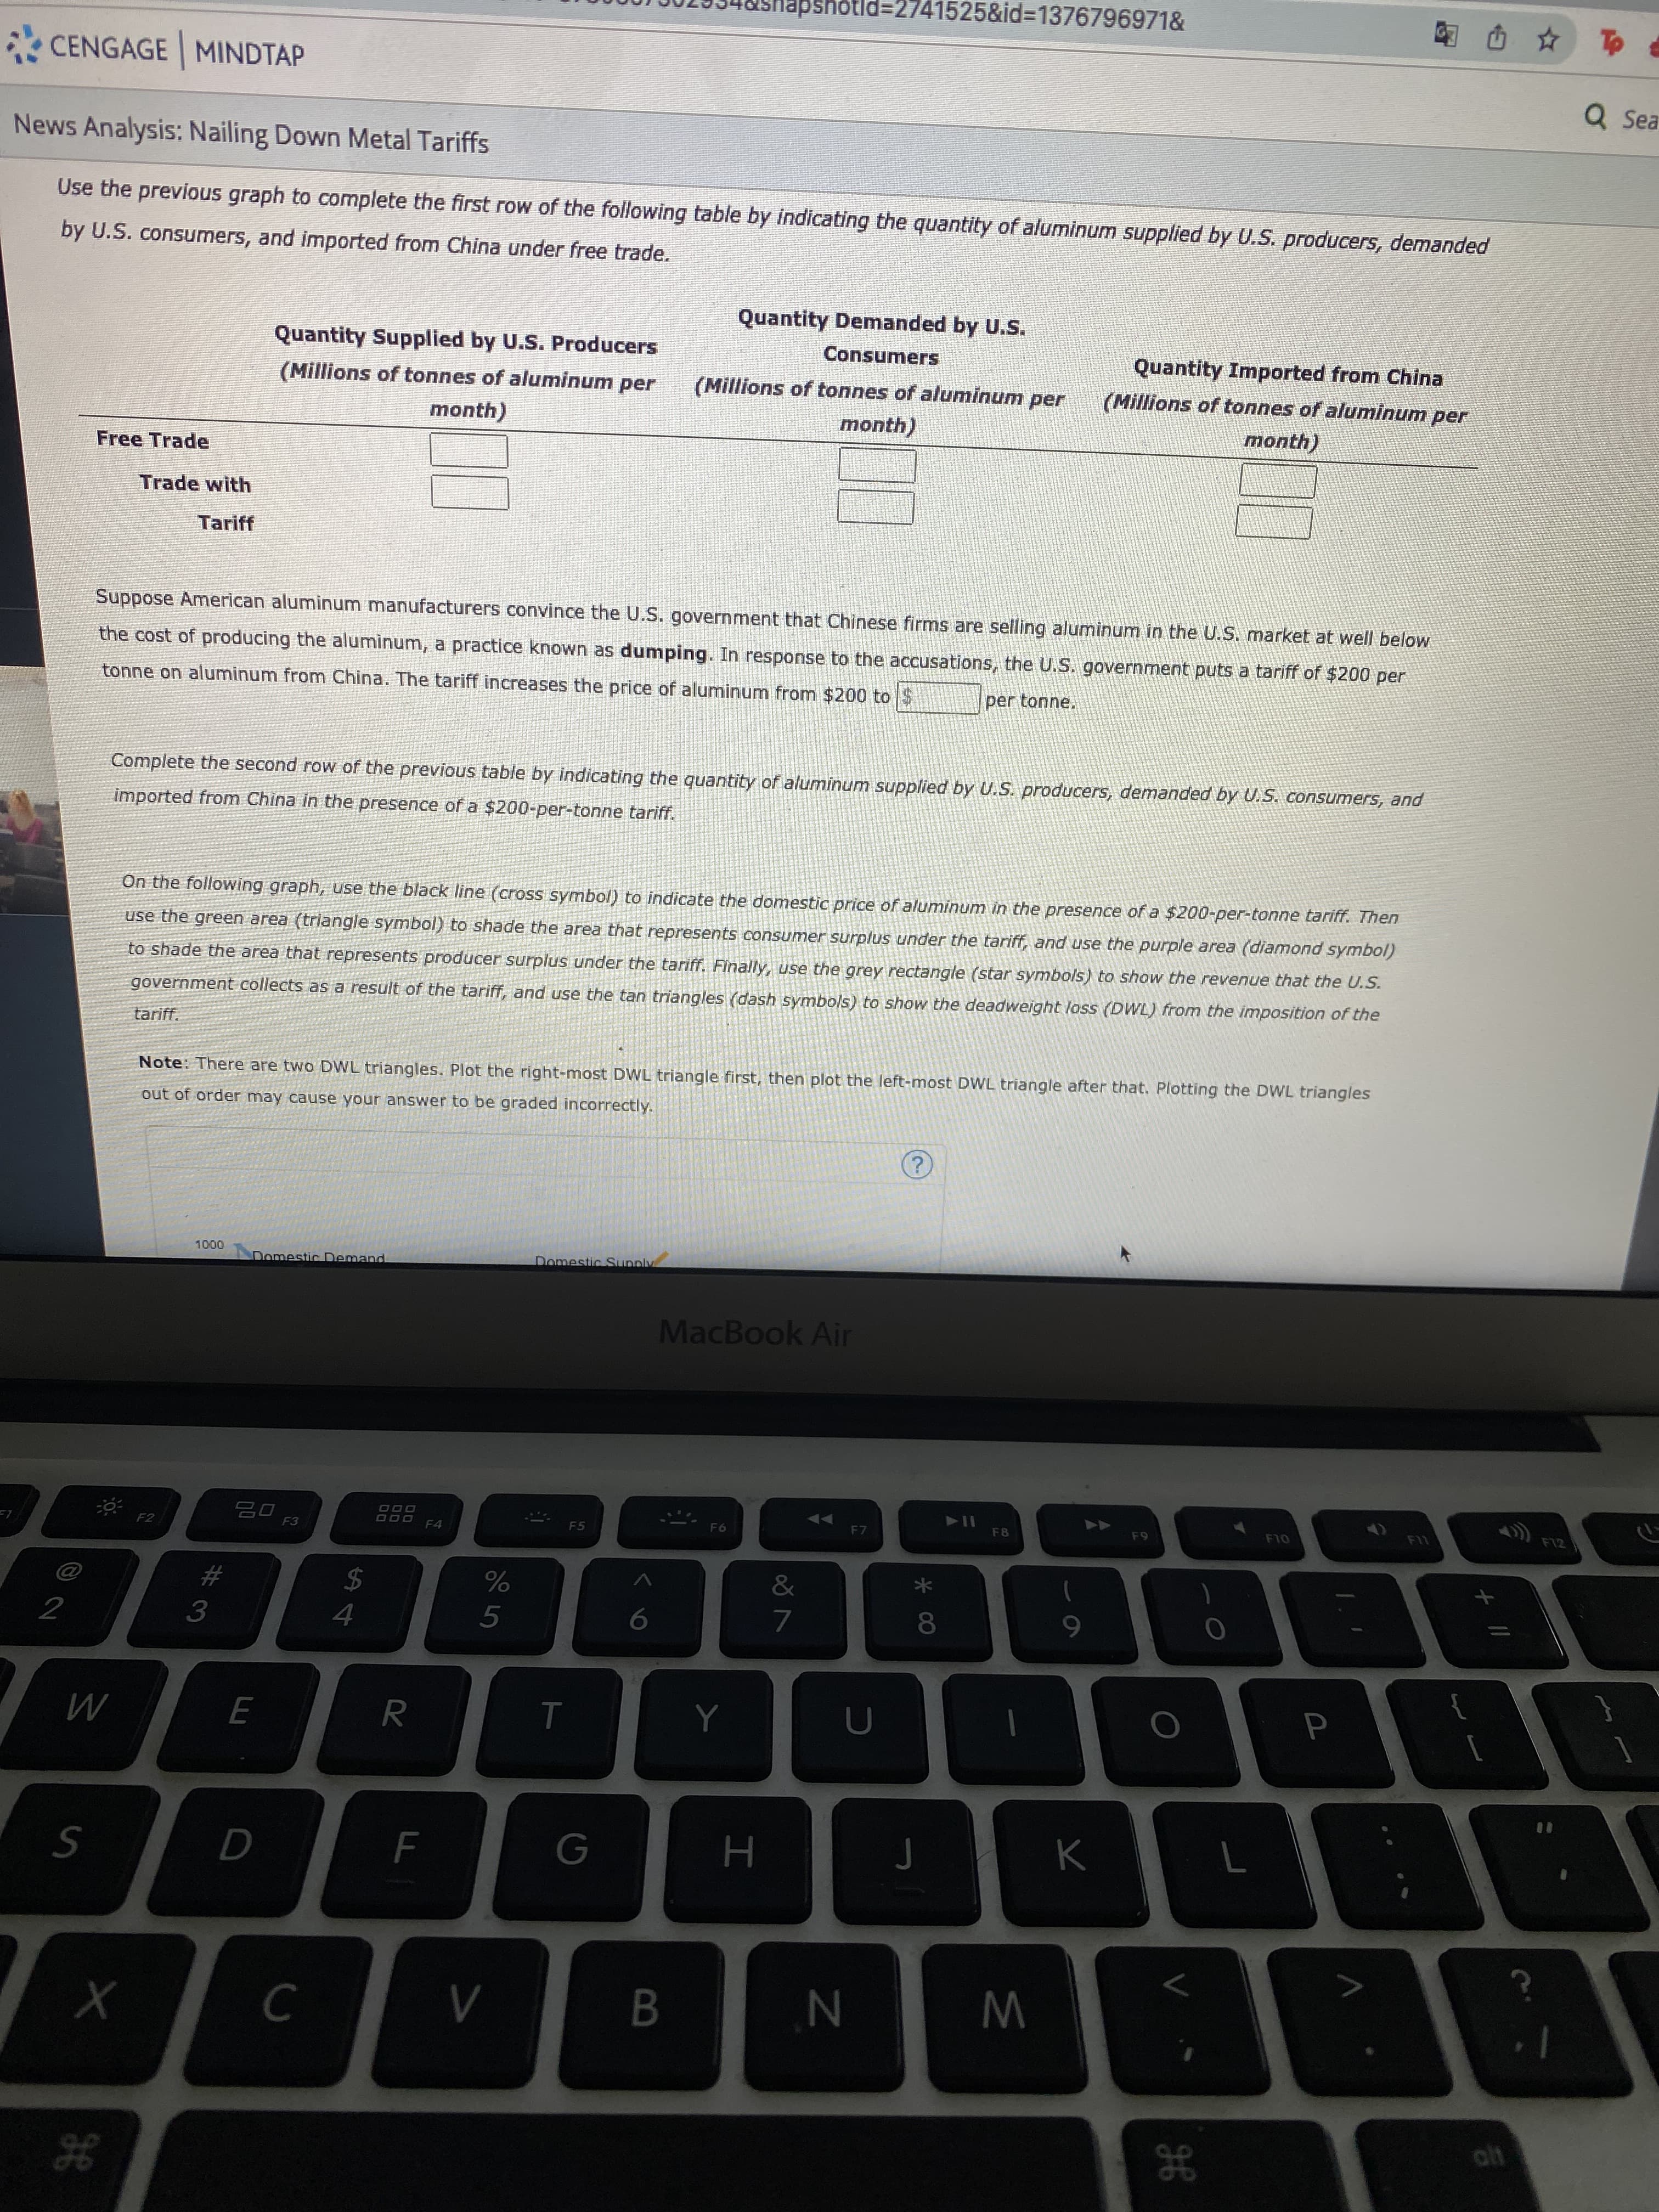
Use the previous graph to complete the first row of the following table by indicating the quantity of aluminum supplied by U.S. producers, demanded
by U.S. consumers, and imported from China under free trade.
Quantity Demanded by U.S.
Quantity Supplied by U.S. Producers
Consumers
Quantity Imported from China
(Millions of tonnes of aluminum per
(Millions of tonnes of aluminum per
(Millions of tonnes of aluminum per
month)
month)
month)
Free Trade
Trade with
Tariff
Suppose American aluminum manufacturers convince the U.S. government that Chinese firms are selling aluminum in the U.S. market at well below
the cost of producing the aluminum, a practice known as dumping. In response to the accusations, the U.S. government puts a tariff of $200 per
tonne on aluminum from China. The tariff increases the price of aluminum from $200 to $
per tonne.
Complete the second row of the previous table by indicating the quantity of aluminum supplied by U.S. producers, demanded by U.S. consumers, and
imported from China in the presence of a $200-per-tonne tariff.
On the following graph, use the black line (cross symbol) to indicate the domestic price of aluminum in the presence of a $200-per-tonne tariff. Then
use the green area (triangle symbol) to shade the area that represents consumer surplus under the tariff, and use the purple area (diamond symbol)
to shade the area that represents producer surplus under the tariff. Finally, use the grey rectangle (star symbols) to show the revenue that the U.S.
government collects as a result of the tariff, and use the tan triangles (dash symbols) to show the deadweight loss (DWL) from the imposition of the
tariff.
Note: There are two DWL triangles. Plot the right-most DWL triangle first, then plot the left-most DWL triangle after that. Plotting the DWL triangles
out of order may cause your answer to be graded incorrectly.
DamesticDemand
Domestic Supply
MacBook Air
02
F3
114
F8
F12
F10
F2
F5
F4
&
$4
4.
%23
9.
6
Y
R.
B.
W
alt
Expert Solution
Step 1
Consumer surplus is the area below the demand curve and above the market price.
Producer surplus is the area above the supply curve and below the market price.

Trending now
This is a popular solution!

Step by step
Solved in 2 steps with 1 images

Knowledge Booster


Learn more about
Need a deep-dive on the concept behind this application? Look no further. Learn more about this topic, economics and related others by exploring similar questions and additional content below.Recommended textbooks for you

Principles of Economics (12th Edition)
Economics
ISBN:
9780134078779
Author:
Karl E. Case, Ray C. Fair, Sharon E. Oster
Publisher:
PEARSON

Engineering Economy (17th Edition)
Economics
ISBN:
9780134870069
Author:
William G. Sullivan, Elin M. Wicks, C. Patrick Koelling
Publisher:
PEARSON
Principles of Economics (12th Edition)
Economics
ISBN:
9780134078779
Author:
Karl E. Case, Ray C. Fair, Sharon E. Oster
Publisher:
PEARSON
Engineering Economy (17th Edition)
Economics
ISBN:
9780134870069
Author:
William G. Sullivan, Elin M. Wicks, C. Patrick Koelling
Publisher:
PEARSON

Principles of Economics (MindTap Course List)
Economics
ISBN:
9781305585126
Author:
N. Gregory Mankiw
Publisher:
Cengage Learning

Managerial Economics: A Problem Solving Approach
Economics
ISBN:
9781337106665
Author:
Luke M. Froeb, Brian T. McCann, Michael R. Ward, Mike Shor
Publisher:
Cengage Learning

Managerial Economics & Business Strategy (Mcgraw-…
Economics
ISBN:
9781259290619
Author:
Michael Baye, Jeff Prince
Publisher:
McGraw-Hill Education