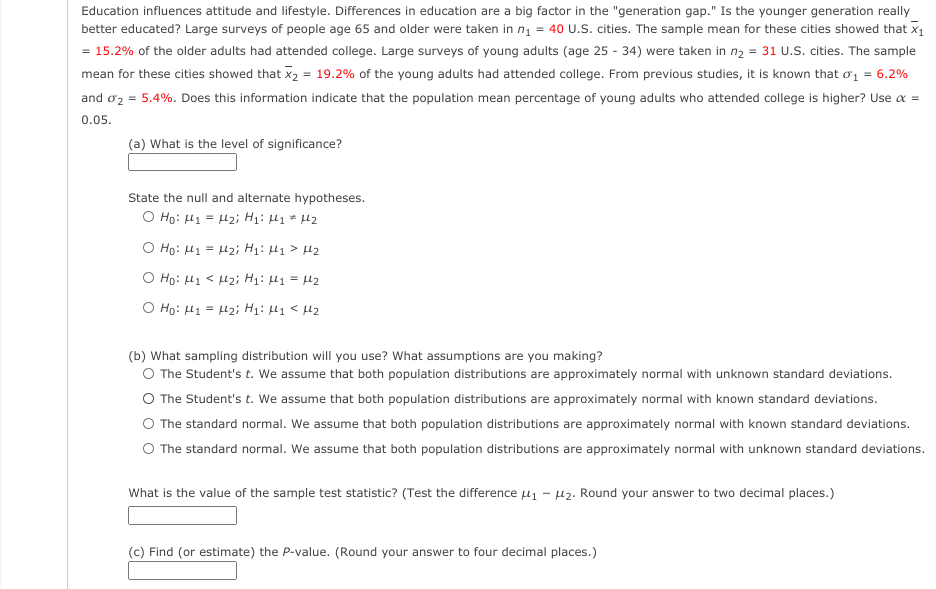
Education influences attitude and lifestyle. Differences in education are a big factor in the "generation gap." Is the younger generation really better educated? Large surveys of people age 65 and older were taken in n, = 40 U.S. cities. The sample mean for these cities showed that x1 = 15.2% of the older adults had attended college. Large surveys of young adults (age 25 - 34) were taken in n2 = 31 U.S. cities. The sample mean for these cities showed that x2 = 19.2% of the young adults had attended college. From previous studies, it is known that o, = 6.2% and o2 = 5.4%. Does this information indicate that the population mean percentage of young adults who attended college is higher? Use a = 0.05. (a) What is the level of significance? State the null and alternate hypotheses. O Ho: H1 = H2; H1: H1 # H2 O Ho: H1 = H2i H1: H1 > H2 O Họ: H1 < l2; H1: µ1 = Hl2 O Ho: H1 = H2; H1: H1 < µ2 (b) What sampling distribution will you use? What assumptions are you making? O The Student's t. We assume that both population distributions are approximately normal with unknown standard deviations. O The Student's t. We assume that both population distributions are approximately normal with known standard deviations. O The standard normal. We assume that both population distributions are approximately normal with known standard deviations. O The standard normal. We assume that both population distributions are approximately normal with unknown standard deviations. What is the value of the sample test statistic? (Test the difference u1 - H2. Round your answer to two decimal places.) (c) Find (or estimate) the P-value. (Round your answer to four decimal places.)


Inverse Normal Distribution
The method used for finding the corresponding z-critical value in a normal distribution using the known probability is said to be an inverse normal distribution. The inverse normal distribution is a continuous probability distribution with a family of two parameters.
Mean, Median, Mode
It is a descriptive summary of a data set. It can be defined by using some of the measures. The central tendencies do not provide information regarding individual data from the dataset. However, they give a summary of the data set. The central tendency or measure of central tendency is a central or typical value for a probability distribution.
Z-Scores
A z-score is a unit of measurement used in statistics to describe the position of a raw score in terms of its distance from the mean, measured with reference to standard deviation from the mean. Z-scores are useful in statistics because they allow comparison between two scores that belong to different normal distributions.

Step by step
Solved in 4 steps with 3 images


