eeps track leprosy cases in the world using World Banks income groups. Data on lepro t countries collected in the year 2011 is sur e below. High Region Income า as rranean World Bank Income Group n 174 54 Upper Lower Middle Middle Income Income 26 36,028 615 6 10 00 216 Low Incom 1,883 604 3,689 0 0 1,155
eeps track leprosy cases in the world using World Banks income groups. Data on lepro t countries collected in the year 2011 is sur e below. High Region Income า as rranean World Bank Income Group n 174 54 Upper Lower Middle Middle Income Income 26 36,028 615 6 10 00 216 Low Incom 1,883 604 3,689 0 0 1,155

Linear Algebra: A Modern Introduction
4th Edition
ISBN:9781285463247
Author:David Poole
Publisher:David Poole
Chapter2: Systems Of Linear Equations
Section2.4: Applications
Problem 1EQ: 1. Suppose that, in Example 2.27, 400 units of food A, 600 units of B, and 600 units of C are placed...

Related questions
Question
Transcribed Image Text:11:14
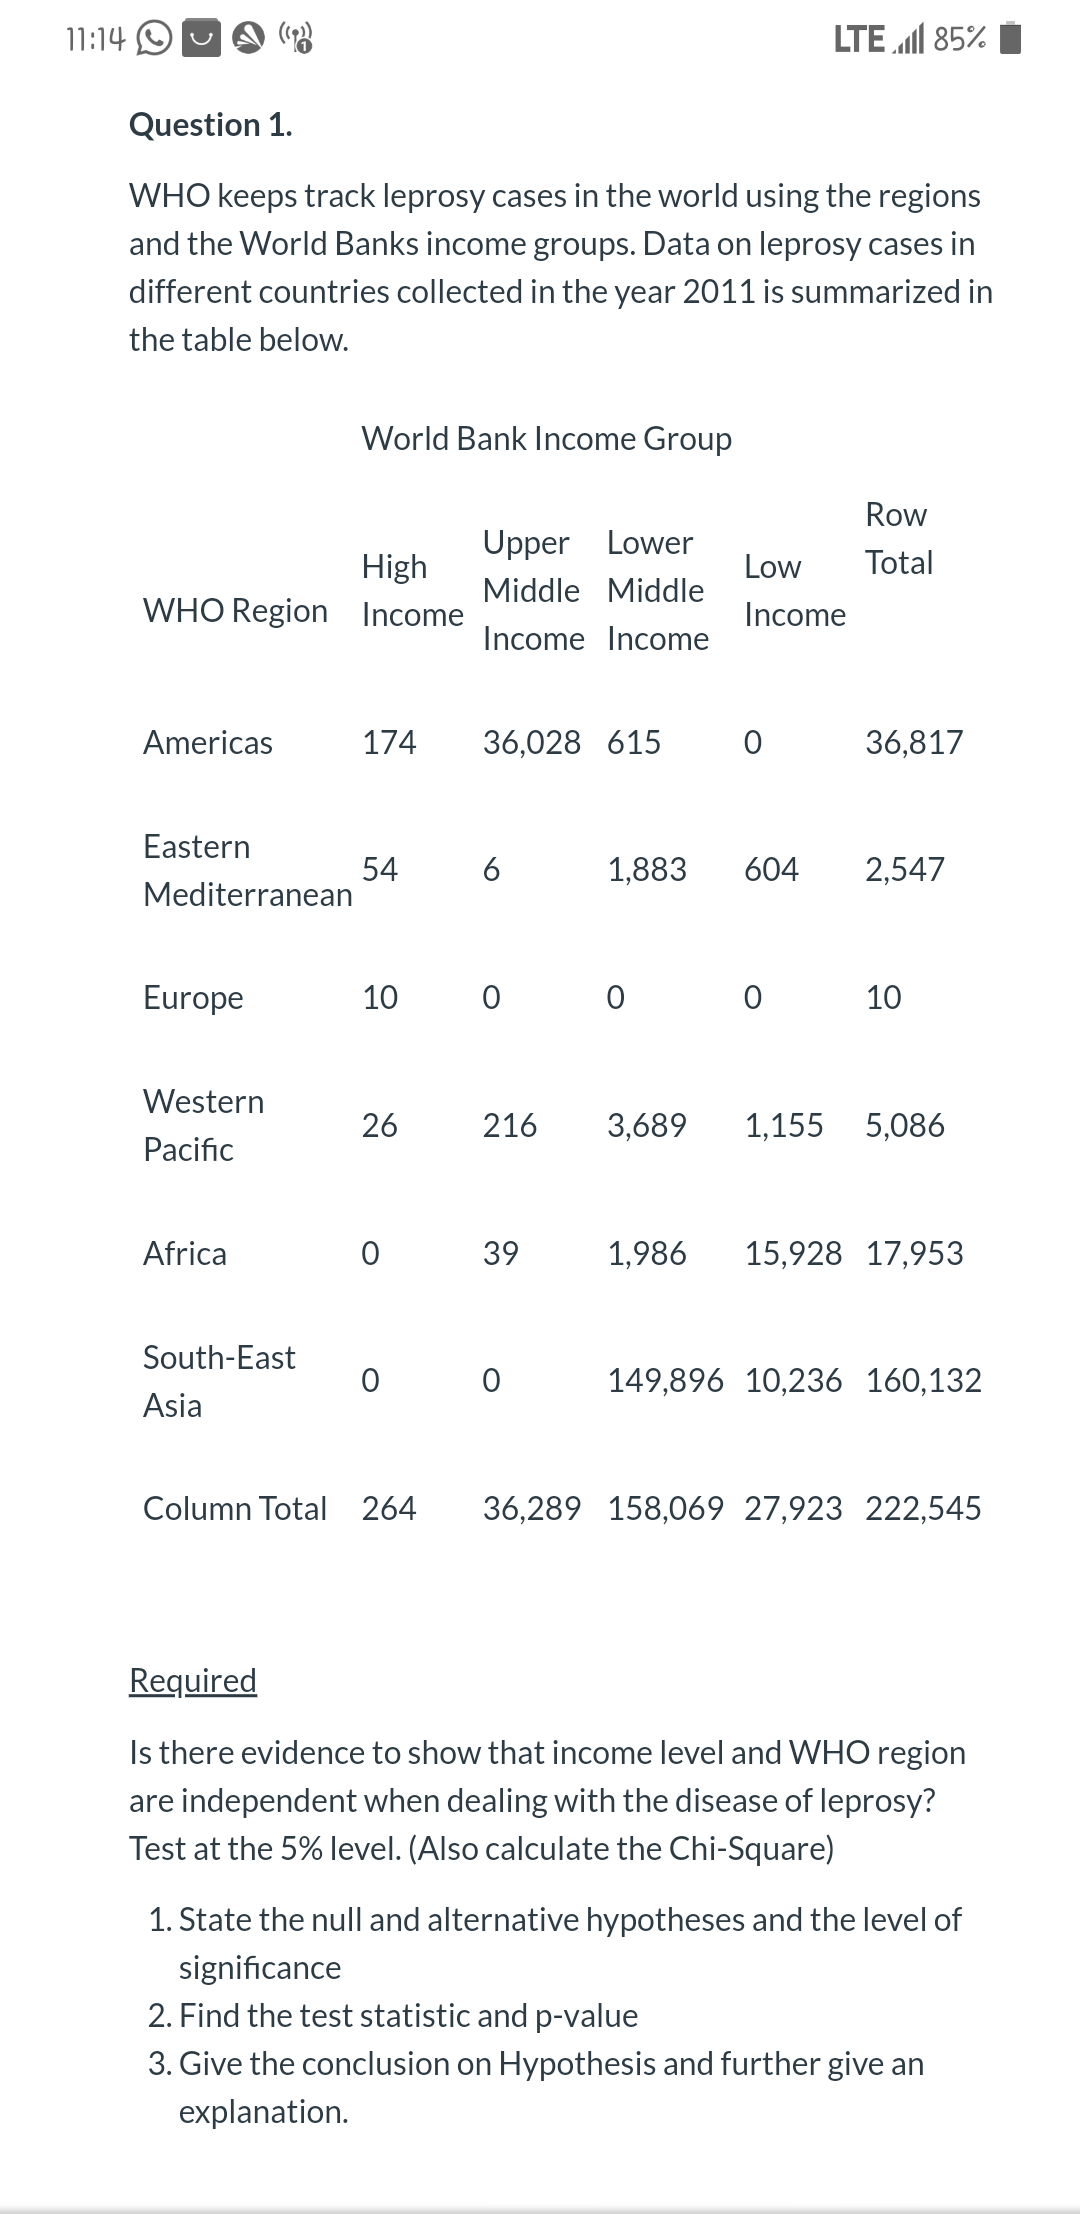
Question 1.
WHO keeps track leprosy cases in the world using the regions
and the World Banks income groups. Data on leprosy cases in
different countries collected in the year 2011 is summarized in
the table below.
High
WHO Region Income
Americas
Eastern
Mediterranean
Europe
Western
Pacific
Africa
World Bank Income Group
South-East
Asia
174
54
10
26
0
0
Upper Lower
Middle Middle
Income Income
36,028 615
6
0 0
1,883
39
0
LTE 85%
Row
Low Total
Income
0
0
36,817
604 2,547
216 3,689 1,155 5,086
10
1,986 15,928 17,953
149,896 10,236 160,132
Column Total 264 36,289 158,069 27,923 222,545
Required
Is there evidence to show that income level and WHO region
are independent when dealing with the disease of leprosy?
Test at the 5% level. (Also calculate the Chi-Square)
1. State the null and alternative hypotheses and the level of
significance
2. Find the test statistic and p-value
3. Give the conclusion on Hypothesis and further give an
explanation.
Expert Solution
This question has been solved!
Explore an expertly crafted, step-by-step solution for a thorough understanding of key concepts.

Step by step
Solved in 3 steps with 4 images

Recommended textbooks for you
Linear Algebra: A Modern Introduction
Algebra
ISBN:
9781285463247
Author:
David Poole
Publisher:
Cengage Learning
Linear Algebra: A Modern Introduction
Algebra
ISBN:
9781285463247
Author:
David Poole
Publisher:
Cengage Learning