Recall the following summary statistics for our sample of white wine pH measurements. Z= z-score for pH of 3.0 X-X S = Variable Name N = -1.24 Z= 3.0 3.1883 = PH Wines with low pH taste tart and crisp whereas wines with higher pH are more susceptible to bacterial growth. A pH of about 3.0 to 3.4 is most desirable for white wines. z-score for pH of 3.4. X-X S Determine the relative standing for a pH of 3.0 and a pH of 3.4 by computing a z-score for each observation, using the rounded values above and rounding each. z-score to two decimals. = 1.40 0.1510 3.4 3.1883 4,898 Mean Standard Deviation Median Minimum Value 0.1510 3.1883 0.1510 3.18 2.72 Maximum Value Taking the absolute value of each z-score gives the following interpretations for each pH. A pH of 3.0 is -1.24 X standard deviations below 3.82 0✓ the mean whereas a pH of 3.4 is 1.40 ✓ standard deviations
Recall the following summary statistics for our sample of white wine pH measurements. Z= z-score for pH of 3.0 X-X S = Variable Name N = -1.24 Z= 3.0 3.1883 = PH Wines with low pH taste tart and crisp whereas wines with higher pH are more susceptible to bacterial growth. A pH of about 3.0 to 3.4 is most desirable for white wines. z-score for pH of 3.4. X-X S Determine the relative standing for a pH of 3.0 and a pH of 3.4 by computing a z-score for each observation, using the rounded values above and rounding each. z-score to two decimals. = 1.40 0.1510 3.4 3.1883 4,898 Mean Standard Deviation Median Minimum Value 0.1510 3.1883 0.1510 3.18 2.72 Maximum Value Taking the absolute value of each z-score gives the following interpretations for each pH. A pH of 3.0 is -1.24 X standard deviations below 3.82 0✓ the mean whereas a pH of 3.4 is 1.40 ✓ standard deviations

Functions and Change: A Modeling Approach to College Algebra (MindTap Course List)
6th Edition
ISBN:9781337111348
Author:Bruce Crauder, Benny Evans, Alan Noell
Publisher:Bruce Crauder, Benny Evans, Alan Noell
Chapter5: A Survey Of Other Common Functions
Section5.6: Higher-degree Polynomials And Rational Functions
Problem 1TU: The following fictitious table shows kryptonite price, in dollar per gram, t years after 2006. t=...

Related questions
Question
100%
i am confused?
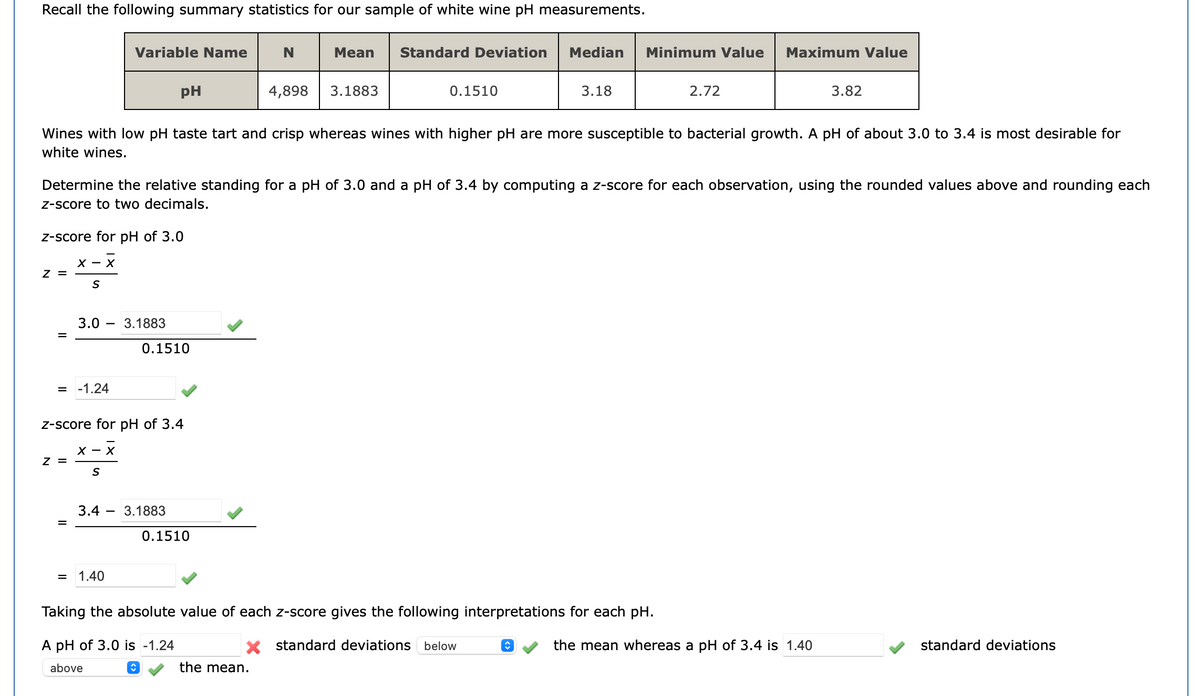
Transcribed Image Text:Recall the following summary statistics for our sample of white wine pH measurements.
Z =
X-
Z =
S
= -1.24
=
3.0
Wines with low pH taste tart and crisp whereas wines with higher pH are more susceptible to bacterial growth. A pH of about 3.0 to 3.4 is most desirable for
white wines.
Variable Name
Determine the relative standing for a pH of 3.0 and a pH of 3.4 by computing a z-score for each observation, using the rounded values above and rounding each
z-score to two decimals.
z-score for pH of 3.0
X - X
S
z-score for pH of 3.4
3.4
1.40
3.1883
pH
0.1510
3.1883
♥
N
0.1510
Mean Standard Deviation Median Minimum Value Maximum Value
4,898 3.1883
the mean.
0.1510
3.18
Taking the absolute value of each z-score gives the following interpretations for each pH.
A pH of 3.0 is -1.24
X standard deviations below
above
2.72
♥
3.82
the mean whereas a pH of 3.4 is 1.40
standard deviations
Expert Solution
This question has been solved!
Explore an expertly crafted, step-by-step solution for a thorough understanding of key concepts.

Step by step
Solved in 4 steps with 4 images

Recommended textbooks for you
Functions and Change: A Modeling Approach to Coll…
Algebra
ISBN:
9781337111348
Author:
Bruce Crauder, Benny Evans, Alan Noell
Publisher:
Cengage Learning

Algebra & Trigonometry with Analytic Geometry
Algebra
ISBN:
9781133382119
Author:
Swokowski
Publisher:
Cengage
Functions and Change: A Modeling Approach to Coll…
Algebra
ISBN:
9781337111348
Author:
Bruce Crauder, Benny Evans, Alan Noell
Publisher:
Cengage Learning
Algebra & Trigonometry with Analytic Geometry
Algebra
ISBN:
9781133382119
Author:
Swokowski
Publisher:
Cengage