ere to search A cellular phone company monitors monthly phone usage. The following data represent the monthly phone use in minutes of one particular customer for the past 20 months. Use the given data to answer parts (a) and (b). 327 528 497 377 322 347 487 434 559 518 494 357 461 523 553 417 521 382 475 364 (a) Determine the standard deviation and interquartile range of the data. S= (Round to two decimal places as needed.) IQR= -(Type an integer or a decimal.) (b) Suppose the month in which the customer used 327 minutes was not actually that customer's phone. That particular month the customer did not use their phone at all, so 0 minutes were used. How does changing the observation from 327 to 0 affect the standard deviation and interquartile range? What property does this illustrate? The standard deviation and the interquartile range What property does this illustrate? Choose the correct answer below. Empirical Rule Resistance Dispersion Weighted Mean O At
ere to search A cellular phone company monitors monthly phone usage. The following data represent the monthly phone use in minutes of one particular customer for the past 20 months. Use the given data to answer parts (a) and (b). 327 528 497 377 322 347 487 434 559 518 494 357 461 523 553 417 521 382 475 364 (a) Determine the standard deviation and interquartile range of the data. S= (Round to two decimal places as needed.) IQR= -(Type an integer or a decimal.) (b) Suppose the month in which the customer used 327 minutes was not actually that customer's phone. That particular month the customer did not use their phone at all, so 0 minutes were used. How does changing the observation from 327 to 0 affect the standard deviation and interquartile range? What property does this illustrate? The standard deviation and the interquartile range What property does this illustrate? Choose the correct answer below. Empirical Rule Resistance Dispersion Weighted Mean O At

Glencoe Algebra 1, Student Edition, 9780079039897, 0079039898, 2018
18th Edition
ISBN:9780079039897
Author:Carter
Publisher:Carter
Chapter10: Statistics
Section10.4: Distributions Of Data
Problem 19PFA

Related questions
Question
Transcribed Image Text:pe here to search
3
$
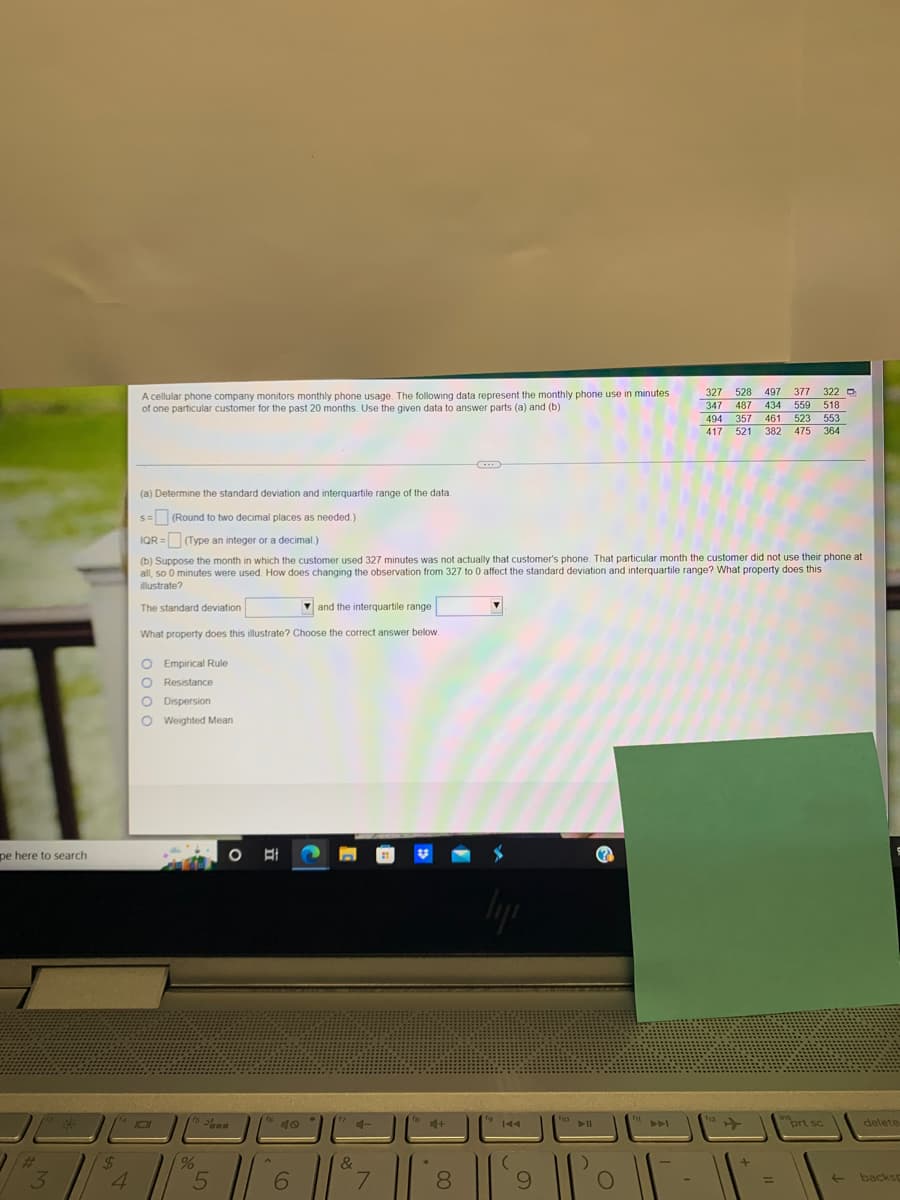
A cellular phone company monitors monthly phone usage. The following data represent the monthly phone use in minutes
of one particular customer for the past 20 months. Use the given data to answer parts (a) and (b).
327 528 497 377 322
347 487 434 559 518
494 357 461 523 553
417 521 382 475 364
(a) Determine the standard deviation and interquartile range of the data.
s= (Round to two decimal places as needed.)
IQR= (Type an integer or a decimal.)
(b) Suppose the month in which the customer used 327 minutes was not actually that customer's phone. That particular month the customer did not use their phone at
all, so 0 minutes were used. How does changing the observation from 327 to 0 affect the standard deviation and interquartile range? What property does this
illustrate?
The standard deviation
and the interquartile range
What property does this illustrate? Choose the correct answer below.
O Empirical Rule
O Resistance
Dispersion
O Weighted Mean
prt sc
delete
backsp
10
CO
4
0000
%
O
Phas
5
6
&
4-
7
fa
4+
8
lyi
fg
144
(
9
f10
► 11
)
O
A4
f12
+
←
Expert Solution
This question has been solved!
Explore an expertly crafted, step-by-step solution for a thorough understanding of key concepts.

This is a popular solution!

Trending now
This is a popular solution!

Step by step
Solved in 4 steps with 1 images

Recommended textbooks for you
Glencoe Algebra 1, Student Edition, 9780079039897…
Algebra
ISBN:
9780079039897
Author:
Carter
Publisher:
McGraw Hill
Glencoe Algebra 1, Student Edition, 9780079039897…
Algebra
ISBN:
9780079039897
Author:
Carter
Publisher:
McGraw Hill